
Most fund managers justify the higher fees associated with the fund by explaining that their skill will allow them to deliver better results than the index. We have taken a unique perspective to examine this argument. Our approach is based around our fee-saving software which allows retirement plan advisors to identify cheaper but similar funds to those existing funds in a plan menu or portfolio. The unique thing about this approach is that we aren’t looking for similar funds by asset class but rather by a quantitative correlation. One common example which we notice in existing plan menus is that a plan may have an expensive active fund but the fund is highly correlated to a bunch of cheaper index funds. Although it may not always be appropriate to replace an actively managed fund with an index fund, it does however raise the question “are you paying high fees for a closet index fund?”.
One of the main arguments against the above question is that the active fund may in fact be highly correlated to the index fund when the market is booming, but the active funds also has the potential to dynamically shift when there is a downturn. Fortunately for this study, there was a downturn in 2018. So, in this article we are going to examine how well these actively managed funds did against their highly correlated indexes.
What correlation are we using?
Our correlation, which we call similarity, is the average of both the returns-based correlation and the holdings-based correlation. Firstly, the returns-based correlation is calculated using a standard Pearson product-moment correlation coefficient. Secondly, the holdings-based correlation is calculated using the funds’ positions and multi-factor risk model based on Arbitrage Pricing Theory and an advanced extension of Modern Portfolio Theory. This is essentially the same model that we use in our Portfolio Crash Testing software.
Which Indexes are we using in this comparison?
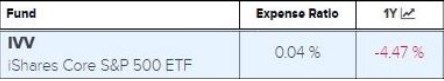
We are comparing the performance of mutual funds for 2018 which are highly correlated to the index. We have chosen the S&P 500 index for comparing these highly correlated funds using iShares ETF IVV as a proxy.
So how did the mutual funds perform against the ETFs?
In short, not very good. For the S&P 500 index we identified 143 unique funds which have a similarity higher than 0.90. Only one share class (the best performing) for each family of funds was used. Of those 143 funds, only 38 had better performance than the iShares ETF. Note, that the fees are already calculated into the performance, so some funds may have performed better but after the higher expense ratio is accounted for, they failed to earn their keep.
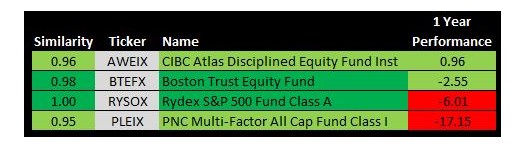
The above table includes some noteworthy funds. CIBC Atlas Disciplined Equity Fund was the best performing in 2018 of all the funds which had a similarity to the IVV of more than 0.90. Boston Trust Equity Fund was the best performing of all funds which were very highly similar with a correlation over 0.97. Rydex S&P 500 Fund (also an index fund) was the most similar to IVV of all mutual funds, but it costs 1.38% per year for the privilege. All the way at the bottom was PNC Multi-Factor All Cap Fund which despite being highly correlated to the S&P 500 somehow managed a 17.15% loss in 2018.
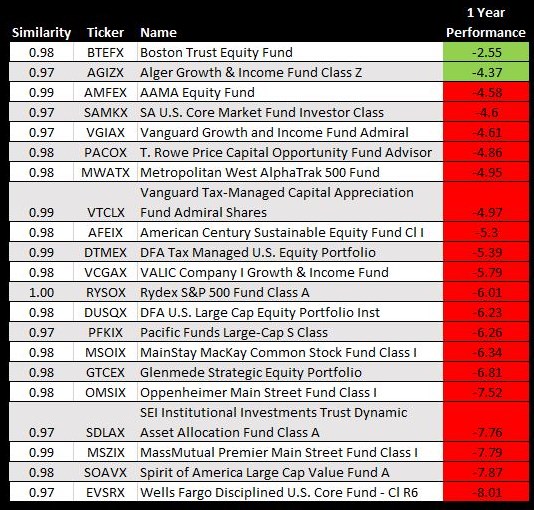
The table below gives a shortened list which only includes the funds which had a very high correlation to IVV of over 0.97. When factoring in the investment expenses of these funds, only two of these funds managed to beat the S&P 500 index.
What about against funds which aren’t highly similar?
A case could be made that by only selecting funds which are highly similar to the index that it logically rules out those funds which were sufficiently different enough to beat the index. To rule out this bias, we compared the index to a balanced portfolio. For this we choose a balanced selections of American Funds R6 share class funds, as they are well known for their good performance. Only the older American funds were considered, as we needed funds which have a 10-year performance history
Below is the list of the funds that were used in this comparison were removed.
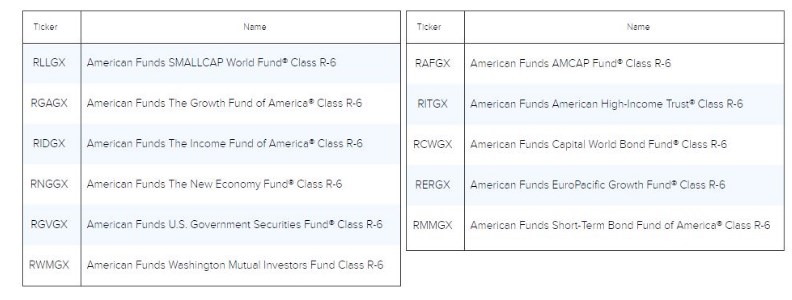
All of the American Funds were grouped together, equally weighted, into one portfolio. The 1, 3, 5 & 10 year performance of the portfolio was compared against the S&P 500 index using IVV.
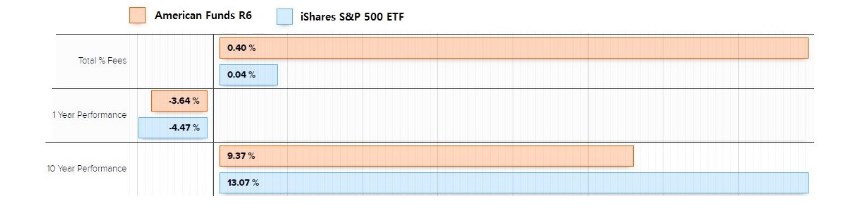
As expected, in the recovery and boom since 2008 the S&P index outperformed a balanced portfolio(65/35). The lower long-term returns, by holding the lower-risks funds, should hopefully be recovered by smaller losses in a downturn. However, looking at the 2018 downturn (1 year performance), it is surprising that the S&P 500 index still reasonably close to a more diversified and expensive portfolio. Perhaps, the 2018 dip wasn’t quite large enough, or the difference would be more dramatic just looking at quarter 4 of 2018. To test what would happen if a larger drop occurred, below we examined the same portfolio during the 2008 crisis.
What about in 2008?
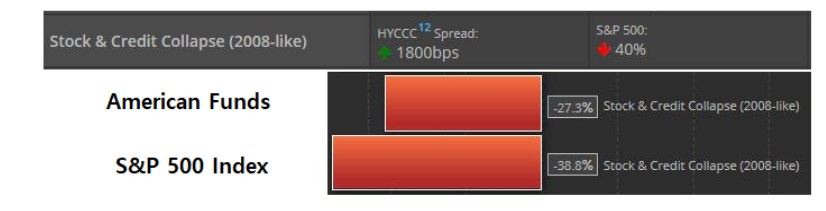
To examine whether a larger downturn than the 2018 dip was needed to justify a diversified portfolio, compared to the S&P 500 index, we stress tested the funds using Larkspur- RiXtrema’s PortfolioCrashTesting tool. We stress tested both the same American Funds portfolio and the S&P 500 index, in a peak to trough 2008-like scenario. The 2008 like scenario was modeled by moving the HYCCC spread up 1800bps and moving the S&P 500 down 40%. This was where the difference started to show.. The American Funds portfolio was down 27.3% in this Stock and Credit Collapse Scenario but the S&P 500 index funds was down 38.8%.
 Conclusion
When the markets were doing well, being in the S&P 500 index seems to be a cheap and competitive option. Obviously, the markets aren’t always doing well. It seems though, that even in a small dip like in 2018, that the S&P 500 index is is still a competitive option. However, when there is a large crash, like in 2008, this is where the S&P 500 index performs worse.
So does this mean that an S&P 500 index could be the only fund which you need? Of course not, but what it would seem to indicate that paying for a fund manager often will drive down your returns without improving your performance. It also seems that sometimes, human interference can make things worse.
There does seem to be some Fund Managers that truly add value, like AMG FQ LONG-SHORT EQUITY FUND (MEQFX) which had a positive 8.12% return in 2018. This fund is a rare example that is not trying to mimic the S&P 500. Although it has high a correlation to the markets daily, it doesn’t correlate monthly. It shows that a good fund manager can dynamically adjust exposure to the markets to value add during market stress.
There is always a risk involved with investing. Looking at the data above, a case could be made that by investing in actively managed funds you are gambling on the fund manager rather than on the market. Further analysis is possible to examine how other indices performed when compared to mutual funds which are also highly-correlated to that same index.
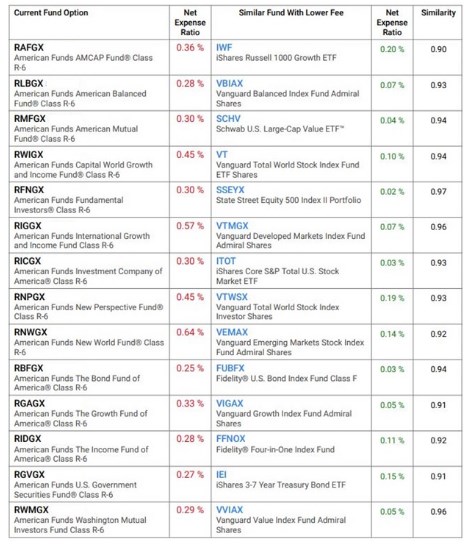
Could you live without Actively Managed Funds?
As an experiment, following-up on the same theme, would it be possible to have a portfolio solely invested in index funds? Well, that is what we did. Again, we used a list of American Funds and processed them in Larkspur-RiXtrema’s 401kFiduciaryOptimizer. This analysis allows you to look at any plan menu of funds and to look for other funds that are cheaper but quantitatively similar to the existing funds. In this example, a filter only allowing ETFs and Index funds was used. The optimizer went through the American Funds portfolio and found a similar replacement for each existing fund. The table below shows the two quantitatively similar portfolios side by side. The main difference is that the portfolio on the left has an average investment expense of 36bps and on the right it is only 9bps.