
The recent equity selloff has dropped S&P 500 10.2% from the September peak to its November 23 trough and removed about $2.5 Tn in market cap from the index. Similarly, the Nasdaq has fared worse with a 14.8% drop from its August peak while global markets have fared even worse, off more than 20% since highs in January 2018. These declines have investors wondering if this is a healthy correction or the ‘R’ word is lurking on the horizon.
The ‘R’ word of course, is ‘recession’. And while top line metrics seem solid (see: GDP, unemployment), there are signs that cracks are forming in the foundation (see: housing starts, length of business cycle expansion). When the specter of recession lurks, more people pay close attention to the yield curve -specifically, the shape of the curve,
Indeed, all 7 recessions since the 1970’s have been preceded by an inversion of yield curve. To find recessions that were not preceded by an inverted yield curve you have to go all the way back to the recessions of 1957 and 1960, where the curve flattened to near zero levels, but never inverted. The primary reason for the curve inversion phenomenon is that investors are anticipating that longer term bonds will be a good place to park assets to weather an economic downturn that will occur at some time in the future, and last for an unknown amount of time.
This buying will in turn will necessitate higher yields on short date issues which causes flattening and sometimes inversion. When investors anticipate lower rates on the horizon, you don’t want to have to reinvest at those lower rates if a bond matures, thus they purchase long enough to avoid that problem.
Exhibit 1: 10-Year Treasury minus Fed Funds Rate
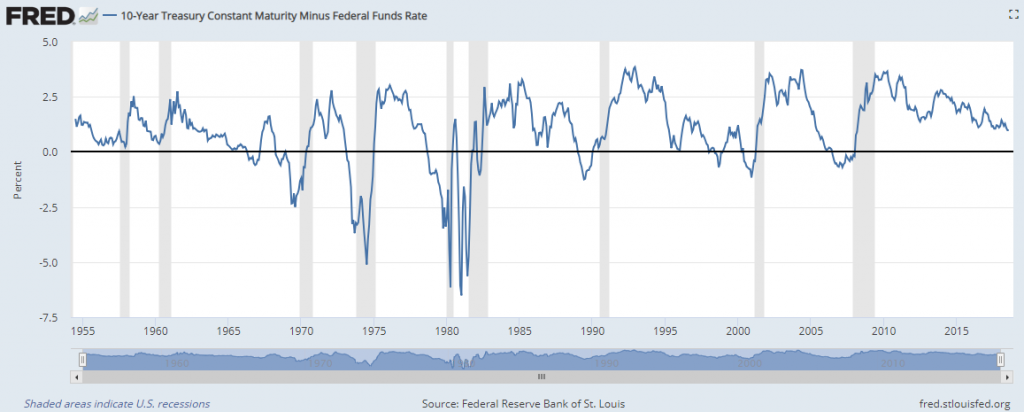
Note: Many practitioners use the 10-Year minus 2-Year Treasury spread to calculate inversion. Due to additional history available, I have used the 10-Year minus the Fed Funds. While timing of the inversions using the two metrics is similar (but not identical), both metrics have inverted prior to the last recessions.
When one looks at the history shown in Exhibit 1, it easy to see the pattern of inversion to recession. But as is usually the case, making decisions when faced with reality is more complicated. Prior to the recession of 2001, the yield curve actually inverted twice, with the first inversion occurring in June of 1998, a full 33 months before the actual beginning of the recession and more than 2 years before the S&P 500 peaked. If in the face of a looming recession, one takes the steps to more conservatively position client portfolios, this is a long time to wait for validation. The S&P rallied more than 30% from inversion to peak, though the index sold off prior to the start of the recession. And if one was watching the Nasdaq (as most were during the dotcom boom), they would have had to watch as the index doubled before ultimately being vindicated.
All this is to say that an inversion does not signal that a recession has begun – there can be a lot of time between the initial inversion and the start of a recession. And there can be some significant gains to be had after the inversion. The performance of the S&P 500 from the time the yield curve first inverts to the start of the recession is shown in Exhibit 2. The length of time between an inversion and recession has varied from 8 months to 43 months.
Exhibit 2: Performance of the S&P 500 from Yield Curve Inversion to Recession
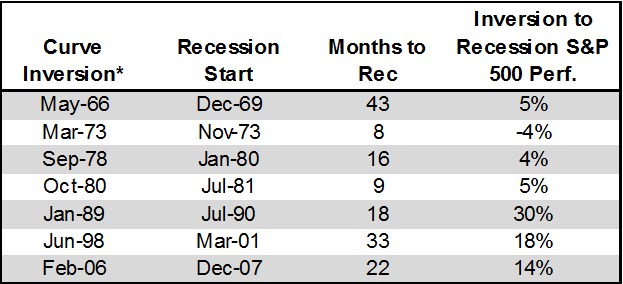
Source: Federal Reserve Bank of St. Louis (FRED) and the National Bureau of Economic Research (NBER)
*Curve Inversion dates are observed using 10-2 inversions except for the periods prior to 1976 when 2-year Treasury data is not available. For those periods the 10-year Treasury minus Fed Funds rate is used to mark an inversion.
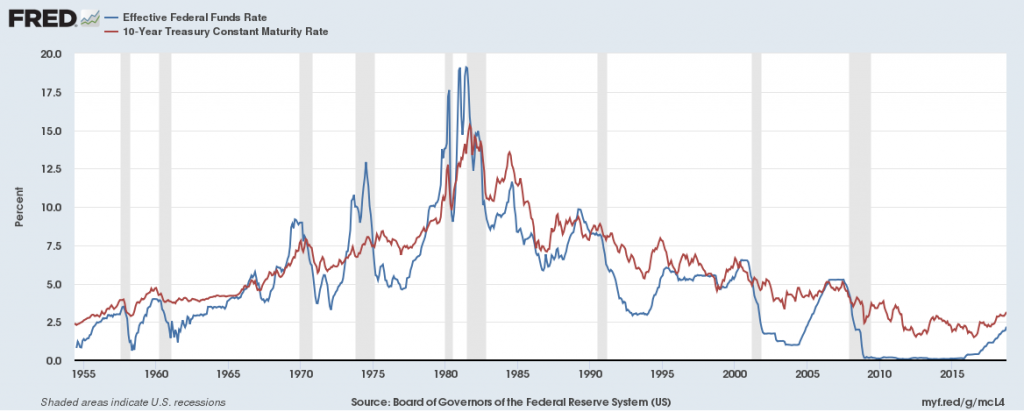
There is one more data point that I think is important –that is the level of the Fed Funds rate. The Fed Funds rate is currently lower than any point immediately preceding a recession (at least since the 1950’s). Said differently, if a recession started tomorrow, the Fed would have less ability to soften the landing than with previous recessions (though as we know, the Fed has more tools at their disposal – See QE1, QE2, and QE3). Incidentally, the yield on the 10-year treasury is also lower than any point immediately preceding a recession which may give investors less incentive to seek the safety of longer-term treasuries and potentially hinder or delay the inversion phenomenon.
Exhibit 3: Fed Funds and 10-Year Treasury Rates
All of this data is measured against the backdrop of volatile equity markets, widening credit spreads, increasing trade barriers, and the soon-to-be politically divided US government. This leads me to conclude that while the yield curve has not inverted and a recession is likely still months away, I do believe that more conservative positioning is prudent.

Pingback : 5 Articles for the Financial Advisor Weekend Reading List: December 1-2, 2018
Pingback : The Importance of Helping Plan Participants During Market Volatility