
- Market Reactions
- COVID-19 Progress
- How is the stress test holding up?
- PCT CUSTOM FACTORS
- Stress Test Loaded for use in PCT
I published a detailed scenario description for our Coronavirus scenario on Feb 12, 2020, and I wrote about what I believe could happen if the Coronavirus (now more widely known as COVID-19, maybe Corona’s lobbyists are behind this) becomes more of a widespread global concern. And it’s been an eventful 12 trading days since that publication. And, I think it is safe to say that COVID-19 is now a global concern and markets have begun to act accordingly.
COVID-19 gives us a rare opportunity to watch a stress play out in real time. And in this case, I actually made a prediction for how markets would react, so this blog will look at the progress of the virus and the suitability of the original prediction given the passage of time.
Market Reactions
I am writing this on Tuesday, March 3, right after the Fed executed a 50bps emergency rate cut and a day after the US markets rallied ~5% on the hope that such a cut was coming. This is the first cut of more than 25bps since 2008. Balancing out the good news of the rate cut was the bad, but completely unsurprising, news delivered in Federal Reserve FOMC Statement that “…the coronavirus poses evolving risks to economic activity”.
The 10-year US bond yield was at 1.15% prior to the cut and plunged to near 1% after the news. The idea that a rate cut is what is needed to get the markets out of their COVID-19 panic is a bit puzzling to me. But this is a well-worn playbook (the binding is taped together and the pages are fraying at this point) that can still make market participants react as expected, at least for one day. The 2-day action seems to be a classic case of buy the rumor sell the news, but it is still early. And of course the yield curve was inverted with respect to the fed funds, and this remains the case even after the cut. Though the rest of the curve has normalized, it is just that all tenors up to the 10Y are lower than the Fed Funds rate, even after the cut.
COVID-19 Progress
We have seen rapidly deteriorating conditions in terms of containment of the virus. Here in the US alone, we have over 100 cases as I write this, and 6 deaths so far. Globally the reported mortality rate has crept up to 3.5% (or 6% if you focus on only closed cases), and the virus has spread to 75 countries. Below is information from the graphic as included in the original post, along with updated data.
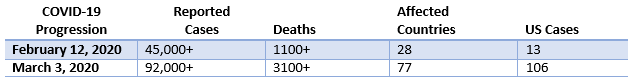
This data assumes that all cases are properly logged and accounted for, which is certainly not the case. In the US, many states won’t be able to test for the virus more widely until the end of this week according to the CDC. I am certainly not a doctor or a pandemic expert, but it seems to me that the lack of ability to test means that the actual number of cases of COVID-19 must be higher than reported. There is also the fact that many COVID-19 cases are mild and are likely not counted. This would indicate that the real number of cases is much higher. The silver lining in this is that under-estimating the real number of reported cases would indicate that the mortality rate must be lower than reported. But as I wrote on Feb 12, it is far to early to calculate the mortality with any confidence.
Countries and communities are in the early stages of figuring out how to deal with this. The Louvre is closed. Hotels (and cruise ships) have been quarantined. Global air travel has been severely affected. The Geneva auto show was cancelled. As the Fed indicated, this pandemic is having an effect on the economy and, in turn, markets.
How is the stress test holding up?
Given that (in my estimation) we are in the early stages of this event, I thought I would examine my original predictions with how the markets have reacted thus far:
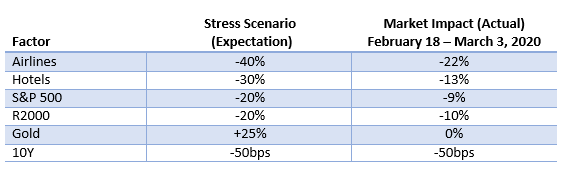
Note: Impacts calculated at 12pm EST, given intraday market moves, these could be very different by the time markets close.
I do not believe that we are at the end of this stress event. I am comfortable with the idea that the markets will get much worse before they get better, so a 20% decline on the S&P still seems reasonable. But, unless the 10Y holds at these levels I certainly underestimated the flight to safety as the 10Y has already declined 50bps. But I also severely overestimated the utility of gold as a safe haven in this environment, at least so far.
The bottom line is that given the unknowns involved with a scenario such as this, I remain comfortable with my original projection, though in hindsight I would have a more dramatic move lower on the 10-year, maybe 75bps. And given that the markets are already expecting another 25bps cut at the March 18 FOMC meeting, I think this likely.
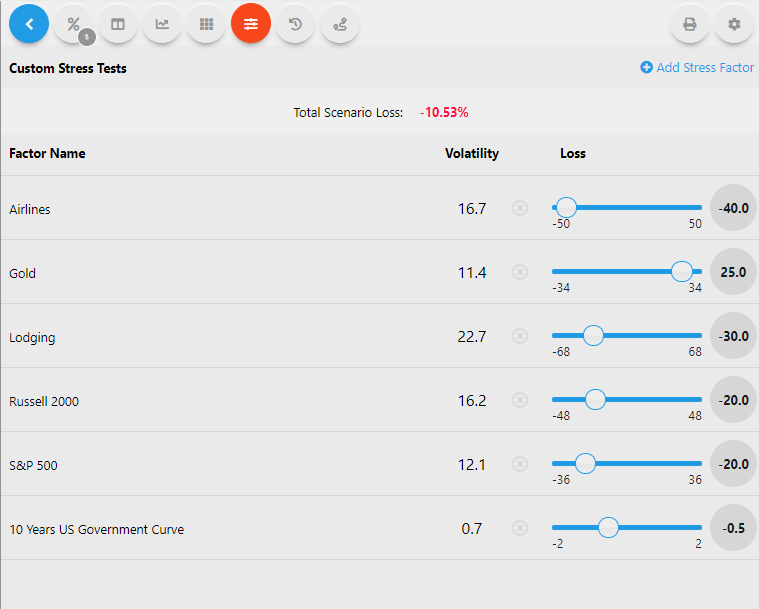
But those are my expectations. The great thing about PCT Pro is that if you disagree with me, you can alter the scenario as desired. Below is a screenshot from PCT with the factors above. Add them to your Custom Stress Tests screen and alter the stresses or factors to create the stress as you see it playing out. Or, use mine.
PCT Custom Factors
Stress Test Loaded for use in PCT
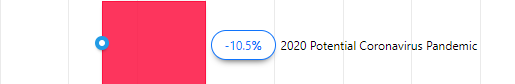
As always, if you have questions regarding the product or would like to see a demo, reach out to clientsuccess@rixtrema.com or click on the link below. And if you need help adding the 2020 Potential Coronavirus Pandemic to your analysis, please read my colleague Nick Davidson’s blog on the topic: https://rixtrema.com/blog/pct-pro-add-or-create-custom-stress-test/