
How to facilitate a conversation about risk & obtain better portfolio outcomes for your clients

At Larkspur-RiXtrema, we create great tools for advisors. Our tools combine quantitative rigor with user friendly interfaces and often, a measure of prospecting to help an advisor grow their business.
Lately we have been focusing many of our blog posts on Portfolio Crash Testing (PCT). Those of you who have spoken with me about PCT know that it is my favorite offering. I believe that it is the best tool on the market to facilitate a conversation about risk between an advisor and client. While PCT makes the risk conversation easy, an advisor can be assured that the analytics behind the scenes are as robust as those used by institutional asset managers.
This is because the models and algorithms that power PCT are exactly the same as those that power Riskostat – our institutional risk platform. Riskostat is the product that launched RiXtrema in 2010. Research published by the RiXtrema team and used in the development of Riskostat won the Peter L. Bernstein Award for top article across all Institutional Investor Journals.
From Client to CEO: Firsthand Experince
Prior to becoming the CEO of RiXtrema, I was an asset manager, and soon after RiXtrema was founded, I became a client of the Riskostat software. My first implementation of the software was when I was the Chief Risk Officer for an outsourced CIO firm. Part of our mandate was managing a large defined benefit pension plan (DB Plan). We had two requirements for a manager to be considered on our platform for potential investment in the DB Plan:
- The manager had to agree to be an ERISA fiduciary to the plan, and
- We had to have complete transparency (holdings, terms & conditions, etc).
These requirements were generally not an issue for most equity and fixed income managers. But it was interesting how many well-respected and well-known hedge fund managers declined to be considered because of the ERISA fiduciary requirement. They were more willing to accept the provision to give us holdings, mostly because they figured that their strategies were too complex for an OCIO to understand or model, so there wasn’t much harm in looking under the hood, so to speak.
And these strategies were complex. Combined they contained almost every type of derivative in use at that time. To utilize the information, I had to be able to model almost everything. For this, I used Riskostat. Very few systems could handle such a diverse set of assets, model risk and perform scenario analysis in such a robust way and provide the results so quickly.
But the question that always comes up, no matter how simple or complex the modeling, is does the system work? How can we trust the scenario outcomes? Since 2008-9, there hasn’t been another crisis, so how do we know the system will work for the next crisis? Below, I will discuss this point in more detail. But one way I know that the system provides credible results is that the work we did on the hedge fund portfolios turned many skeptics into converts. The modeling we did of their strategies was so good that many hedge funds adopted the Riskostat platform for their own use.
Another way we know the system works is by looking at events that are stressful, but not of the magnitude of previous crises. And there have been several such events that show the system works. I personally experienced several of these events in real time, and they helped shape decisions I made in the DB Plan.
The Proof Is In The Pudding: How portfolio crash testing worked for me.
Riskostat shares the same DNA with PCT, but Riskostat contains more features like risk factor decompositions, marginal contributions to risk, etc. All the things that quant geeks require in a system. But PCT makes the information more accessible and easier to incorporate in a conversation with a client. It also contains the most important feature of Riskostat: Crash testing (aka scenario analysis). Here is one of the key events that convinced me that crash testing really works.
In my role as the Chief Risk Officer of an OCIO, I had modeled all the managers on our platform using Riskostat. There was one platform hedge fund in particular that was problematic. They never lost any money for our client, but they never made money either. During 2011-2015, this was a real issue. The historic returns of the fund were about 1.75%-2.5% p.a., and at a 2% management and 20% performance fee, the manager made more off of a $100M investment than our client did. Further, using the Riskostat software, I didn’t see any way that this manager could make money in the future. The portfolio was so risk controlled that they were impervious to all but the most idiosyncratic of events. With this information, I decided to pay the manager a visit to find out how they expected to make money for my client.
So I flew to New York and met with client, PC and Riskostat software in tow. We met in a conference room where I had projected the modeled version of their portfolio for all to see, and I asked them how they expected this portfolio to make money.
They replied that the portfolio was positioned to make significant gains when Japanese credit spreads widened. I asked “by how much”. They replied “600 basis points”. So I clacked in a 600bps widening of Japanese credit spreads and Riskostat showed that they would make about 1.25%. They were stunned at the speed of the software, and asked if I really did anything, then they replied that my results were impossible. In particular, they argued that Europe and North America would remain unaffected by such an event.
So I keyed in what they thought the market effects would be in such a scenario. And we kept modifying and modifying, taking their ideal scenario further and further away from market conditions that would be expected in such an event. The best result we got, even with unrealistic assumptions, was that the strategy would make about 2% in their perfect storm. We were doing modeling that they were unable to perform themselves.
Further, the conversation led me to realize that the manager really didn’t care about Japanese corporate spreads widening, they cared about spreads widening in 3 Japanese credits in particular. Of course, their response was that we modeled the scenarios and assets improperly and they would make “well over 10% and closer to 20% in such a credit widening event”.
The conclusion I came to, was that the manager didn’t have a good handle on how they were positioned or how they would make money for my client. They didn’t understand how their European positioning was offsetting their Japanese positions. An event would have to play out perfectly for them to make money and we didn’t think such a scenario was realistic. Against the backdrop of 3 consecutive years of disappointing returns, my firm fired them. But we still had 90 days before the client would get their money back.
During this time, their event occurred (or at least a version of it). While the Japanese credit market in general widened slightly, 2 of their 3 names did widen considerably. And during the 3 months that we waited to redeem, the manager did make 2% for our client. And because they didn’t take us off their distribution list, I know that over the rest of the year, they resumed making almost nothing for their clients. Exactly the way I expected it thanks to the Riskostat software, which in turn increased my confidence in the analytics.
How PCT Works
Our model has a lot of factors. The US Equity Markets, Australian 10Y Bond, British Pound and most other factors that you can think of are in our model. It is not an equity model that has been modified to accommodate fixed income and other asset classes, it was constructed from the ground-up as a true multi-asset class model.
Any factor in our model can be ‘stressed’. When I use the word ‘stress’, I simply mean that the factor can be changed by some amount in any direction – we aren’t limited to extreme scenarios. If I ‘stress’ a factor, US Equities for example, reactions are inferred for every other factor in the model. If create a scenario where US Equity markets fall, this will imply that I am expecting the yield on the US 10-year bond to fall (bond prices will rise). But if I think that equity markets will fall and US 10-year rates will rise, I can create a scenario that looks at the effect of falling US Equity markets and rising US 10-year bond yields by overwriting the implied impact on the US 10-year bond (or I can start with desired yields and overwrite US Equity markets). This will, of course, have implications to the rest of the implied factor movements and the model will adjust accordingly. In this way we can look to what we think will happen in the future without being limited to what has happened in the past.
In PCT, we have modeled over 100 scenarios for our clients to utilize. Every scenario is different in one way or another. Some scenarios model what has happened in the past (the Stock & Credit Collapse is similar to the 2008 Financial crisis), while others model what may happen in the future (the 2018 Fed Severe Scenario is based on documents published by the US Federal reserve).
Both past and forward-looking scenarios are useful in different ways.
![]()
Modeling the Past
Modeling involves uncertainty. Even past events contain some uncertainty – how do we know how a company that went public in 2015 would have performed in back in 2008-9? We don’t, we have to make some assumptions, and assumptions create uncertainty. The only thing we know with 100% certainty is that the 2008-9 financial crisis will never be repeated in exactly the same way. So why use it?
Since almost all clients have an understanding of the severity of the 2008-9 financial crisis event, it helps to provide a context for the expected losses the portfolio would endure. To a lesser extent, events like the dotcom bust and the LTCM meltdown can provide context of less severe events, but fewer clients will have such strong memories of those events. And because we can get very close to modeling the impact a past crisis would have had on a portfolio held today, the analysis is useful, even if it isn’t perfect. The impact of the financial crisis would have been on a standard simple 60% Equity/40% Bond portfolio is shown in Exhibit 1.
Exhibit 1: Impact of a Credit Event Similar to 2008-9 on a 60/40 Portfolio
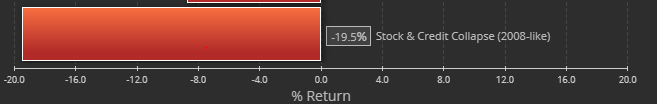
Even when we model the past, we don’t simply look at what an asset did during the crisis and use it, we look at the makeup of the asset today and get a feel for what it would do if the crisis repeated itself. It is a very subtle but important difference.
While past events can be very useful in conversations with clients, they are not the most powerful way to illustrate potential impacts on the portfolio. For that we look to the future.
Modeling the Future
If we can’t get 100% accuracy in modeling the past, we surely can’t be perfect modeling the future. But that isn’t the goal – the goal is to get an understanding of the ways that portfolio will act given certain events and adjust the holdings if required. And even if we can’t get the factor stresses of the event exactly right, we gain a valuable understanding of how the portfolio will perform in a similar event.
My favorite scenario in PCT for demonstration purposes is the 2018 Fed Severely Adverse Scenario. Every year the Dodd-Frank Wall Street Reform and Consumer Protection Act requires the Board of Governors of Federal Reserve to conduct supervisory stress tests of various financial institutions.They publish three supervisory scenarios (Baseline, Adverse and Severely Adverse, all of which are available in PCT), which detail how they expect the markets to react against various macroeconomic backdrops.
As the Fed describes, the Severely Adverse Scenario:
“The severely adverse scenario is characterized by a severe global recession that is accompanied by a global aversion to long-term fixed-income assets. As a result, long-term rates do not fall and yield curves steepen in the United States and the four countries/country blocks in the scenario. In turn, these developments lead to a broad-based and deep correction in asset prices–including in the corporate bond and real estate markets. It is important to note that this is a hypothetical scenario designed to assess the strength of banking organizations and their resilience to unfavorable economic conditions. This scenario does not represent a forecast of the Federal Reserve.”
The Fed goes on to detail each expected market factor reaction in this scenario, from US Equity markets and the VIX to Treasury yields and the dollar to international markets.
This is where we see the true power of PCT. These factors can be modeled exactly as the Fed describes, and the impact on the portfolio can be seen. Exhibit 2 shows the Fed Severe scenario on our 60% equity/ 40% Bond portfolio.
Exhibit 2: The Impact of the Fed Severe Scenario on a 60/40 portfolio
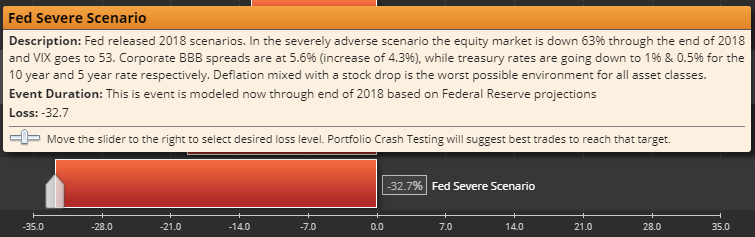
The factor stresses seen in the Fed Severe scenario are not unlike those that would be naturally implied by the model if we simply put in 63% decline in US Equity markets. But we are still required to overwrite the implied stresses with the values supplied by the Fed to accurately model the scenario.
The ability to overwrite implied factor stresses is extremely important, particularly when modeling secondary factor scenarios. A great example of secondary factor modeling can be seen using oil prices. One can’t simply model a rise in oil prices and accept the model results. For example, if I want to model an increase in oil prices, am I assuming the increase is due to supply constraints or demand dynamics? It is important to consider what the expected impacts on other factors may be in a given scenario. Exhibit 3 shows how the assumptions can alter the results of each scenario.
Exhibit 3 – Scenarios in which oil prices increase when examining a 60% stock/40% bond portfolio.
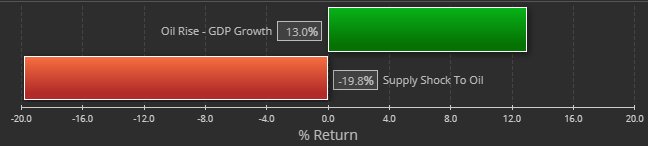
These scenarios clearly illustrate that not all oil price hikes are created equally. If an oil price rise occurs as a result of a robust economy, we would expect our 60% stock/ 40% bond portfolio to increase in value due to strong equity returns (primarily). But we would expect damage to the economy and markets if oil prices rose due to a supply shock, a war in the middle east that disrupts extraction or delivery, for example. Thought must be given to why a scenario is occurring and how other factors will be affected.
PCT has scenarios that never happened but had some degree of likelihood (we modeled a LePen victory in France) or have happened in a way that is was unexpected (our Trump Trade Wars scenario has arguably begun, but the markets have not reacted as modeled, possibly overwhelmed by another scenario that has begun, Trump Tax Cuts that is playing out closer to as expected) and events that may one day happen (a China Corporate Credit event). This flexibility to create ‘what if’ scenarios is part of what makes the tool so useful.
We can model scenarios that are important to both you and your clients. We can work with you to incorporate your macroeconomic scenarios into PCT so you can incorporate them into your client conversations. The thought you put into your scenarios can be used to gain a more complete understanding of your client’s portfolios and encourage more robust conversations with your clients. And hopefully this will help you obtain better portfolio outcomes for your clients.
We think about this stuff a lot and we would like to help make a robust risk conversation a part of your business.
Be sure to request your personal demo if you would like to learn more.