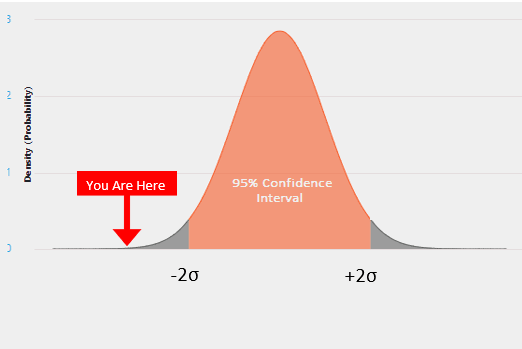
If there is one theme that underpins our writing on risk, it is that stress testing and scenario analysis are far superior to value at risk (VaR) measures. It is clear that VaR is not made for the market moves that we have been experiencing. If we use normal distributions, which is the foundation of VaR, a single -10.9% move on the S&P 500 (as occurred today, March 16, 2020) would be about a 13-standard deviation event. Meaning that it should occur once in the existence of the planet. We just had a events of -11 and -13 standard deviations a separated by a single trading day (not to mention that the day separating those days was a +10 standard deviation event). These are not the first such daily extremes of our lifetime. And VaR doesn’t handle them well.
The same thing happens when we look at portfolios. If the component parts have essentially ‘broken’, then the portfolio VaR is probably not very useful either, as we will see below. As my colleague Daniel Satchkov is fond of saying, “VaR is like an umbrella that only works when it doesn’t rain.” Meaning that VaR works fine when everything is normal, but during turbulent market stresses when you need it most.
The better way to understand and communicate potential market outcomes is stress testing. I have detailed our pandemic stress tests (here and here), and the scenario I designed appears to have been too conservative. But what if I had gotten the stress test exactly right? How accurate would my portfolio scenarios have been?
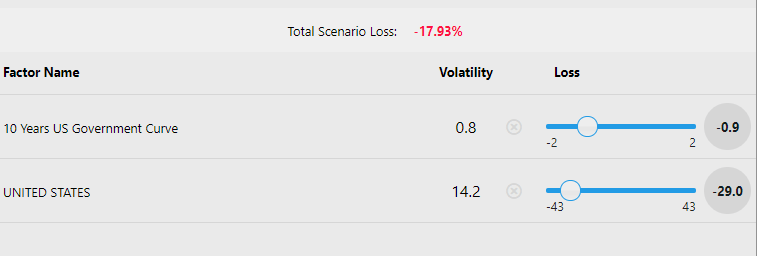
Obviously, getting the S&P 500 exactly right is pretty easy. If I forecast a 20% drop in the S&P, I get a 20% drop in the S&P. But for actual portfolios with mutual funds, stocks, bond and anything else, this calculation is much harder. What we find is that stress testing is really accurate in almost any market environment. That’s the beauty of stress testing, and this can’t be said of VaR. If I stress my portfolio with a 29% loss in US equities and a -85bps move in the US 10 year (the market moves from February 18 through March 16), most portfolios will show results very close to the loss that they have suffered since February 18.
A portfolio that was invested 60% in the S&P 500 (using SPY ETF) and 40% in the Barclays Aggregate (using the AGG ETF) would have lost -17.5% during the current crisis. Creating a stress test with only the 10Y and the US Stock market, the portfolio would have been expected to lose -17.9%.
Stress Test Setting for February 18, 2020 through March 16, 2020
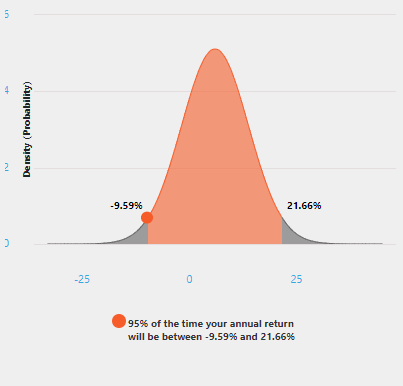
What does VaR say? That the portfolio shouldn’t lose more than 9.6% in a year, 97.5% of the time. Clearly, that is not useful when you need it most, the other 2.5% of the time. Right now, over a certain market move. And I was generous in making the comparison against a full year VaR estimate. It gives the user no way to manage expectations in a crisis with an unknown duration. Even if you are not surprised by the market moves of the past few weeks, how do you convey that to your clients using VaR?
Calculated VaR for a 60%/40% Portfolio (95% CI, 1-Year Horizon)
The obvious criticism for stress testing is that there is no way to know exactly what the markets are going to do. Even if we think very carefully about a stress, we can get it wrong. And that is absolutely true. The 2020 Potential Coronavirus Pandemic only models a -11.2% decline for the 60/40 portfolio because I underestimated the market fall and the move in bond yields. But if we don’t have confidence on the accuracy of a particular scenario, we can still look at market movements over a range of scenarios to get a very accurate representation of expectations, even without knowing what every asset class is going to do. That would still be far better than using VaR.
The graphic below simply looks at the 60/40 portfolio we have been using over different stock market moves. PCT Pro stresses each individual factor automatically based on past relationships.
US Equity Market Stresses on a 60/40 Portfolio
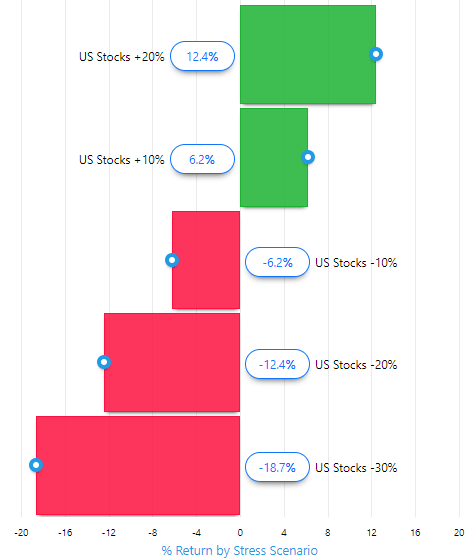
If the US equity market falls 30%, I would expect the 60/40 portfolio to fall 18.7% according to these stress tests. That is a bit more than what we have observed in this crisis (-17.5%), but far, far better than anything you could get from VaR. Imagine the client conversation using both stress testing and VaR. Using stress testing, you are within a 1.5% of the portfolio value. With VaR, the portfolio has exceeded the lower bound of the 1-year, 95% confidence interval by more than 8%.
To be clear, we are not against using VaR as a measure in all cases. The VaR calculations you see in this post come from our software, so we do have it as a portfolio measure. But it is imperative to understand the limitations and use VaR in appropriate ways. And it is also imperative to supplement VaR with stress testing.
Given the volatility that we have been through in the last month, we encourage those of you who haven’t looked at PCT Pro to sign up for a demo. We’ll be happy to walk you through the functionality and get you on your way to having risk conversations that hold up in any environment. In short, we sell umbrellas that actually work in the rain.