My wife recently received some market commentary from a large institutional bank (who will be referred to as THEY in this blog, as THEY are a client and who THEY is doesn’t really serve the post so THEY will remain anonymous), which she decided to read to me. At first it was the typical commentary – “Trump wins, oil rallies”, “Biden wins, marijuana stocks rally”. All that is fine, everyone has an opinion on winners and losers in a specific scenario. While I might disagree, that’s not the point. It is the next part of their market commentary that really bothered me.
The part where they wrote about the expected market impact of a a ‘contested election’ – an election where the winner is not immediately known and results are delayed. They discussed the market volatility that could arise in such an event and the possibility of left tail risk that could result in such a scenario. Still, so far, so good, nothing about that is particularly disagreeable. I can also envision some serious market volatility if the 2020 election is contested depending on circumstances.
But then I came to the part where I got a bit disgusted and decided to write this post – the part where they wrote that a 2020 contested election could result in a decline in equity markets because that is what happened last time the US had a contested election. The last time as in 2000, Bush v. Gore. And when the 2000 election was contested, their argument goes, the markets reacted to the uncertainty with a left-tail like reaction.
Which is a great story if you focus only on the date of the election (November 7, 2000) and the date of the Gore concession (December 13, 2000). Actually, scratch that, it’s only a great story if you don’t look at any data and ignore what a left tail event is. Let me share 2 graphics with you to illustrate why this is faulty logic. I will use the S&P 500 for this illustration, just like the authors of the original piece.
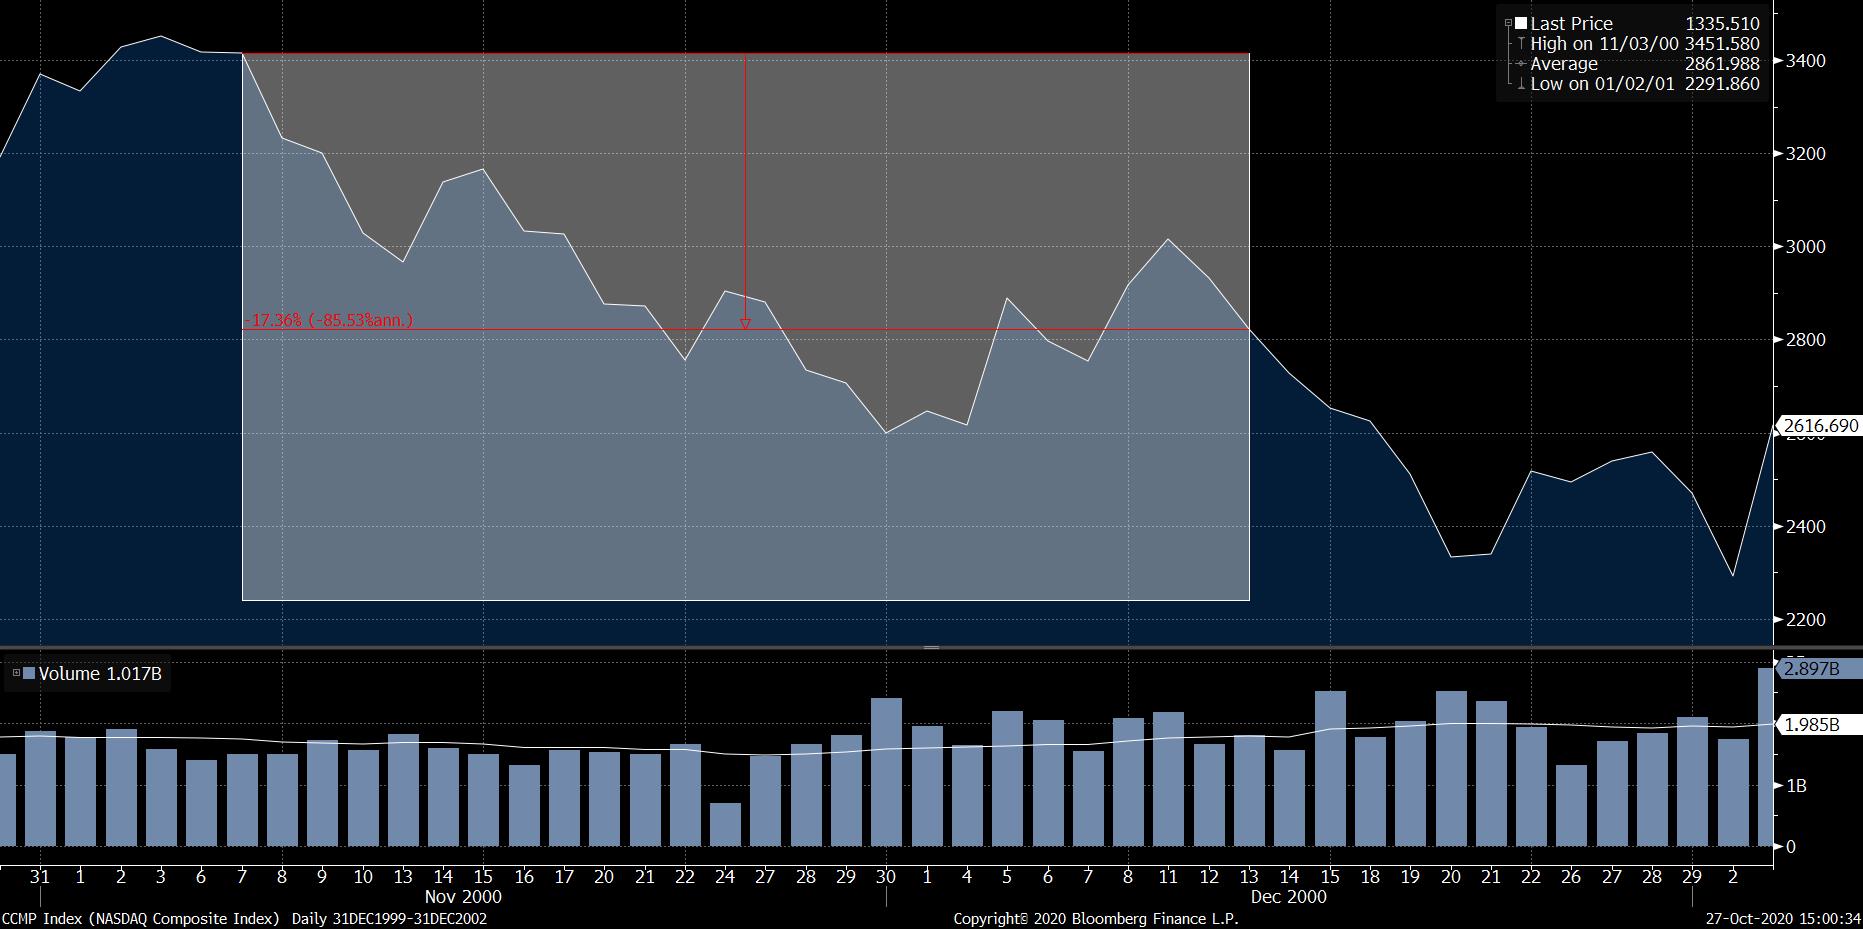
The graphic below is the market action in the period a bit before election day on November 7 through a few days after concession December 13, 2000. The highlighted period is the period in question, a period of about 25 trading days. And focusing in on this period (as the authors did) does make it look like we have some turbulence related to the election uncertainty that lasts for a few days after Gore’s concession.
S&P 500 Performance During the 2000 Election Uncertainty
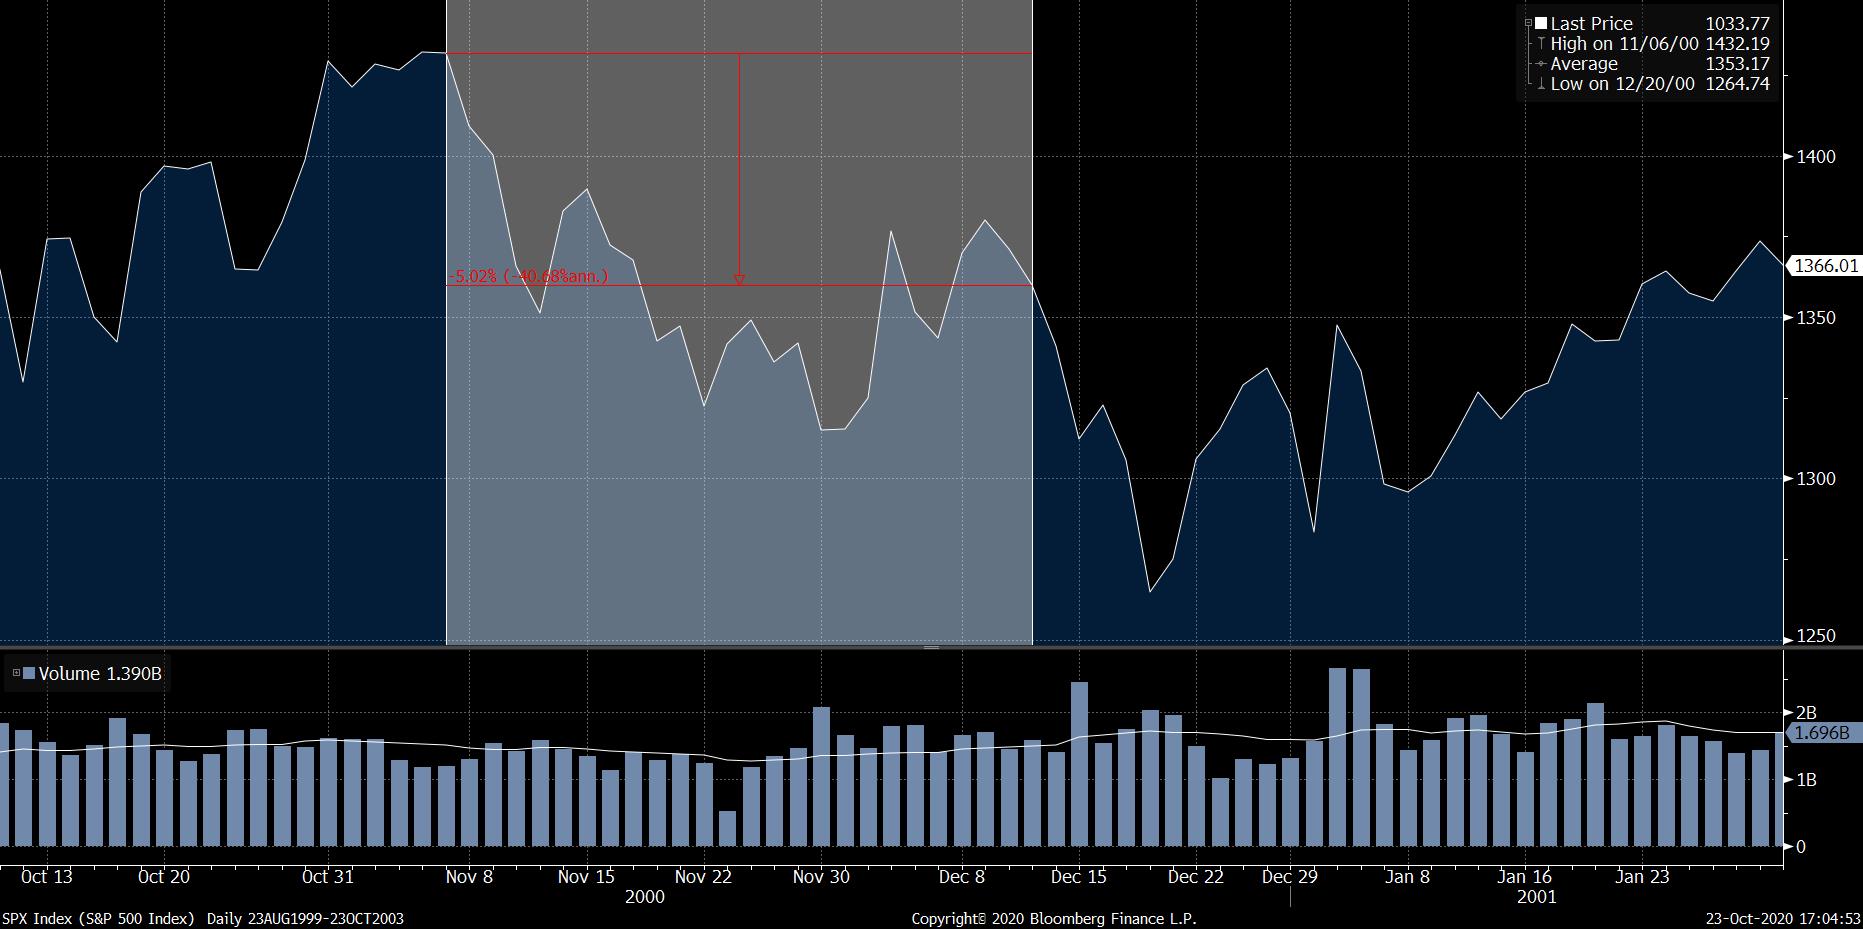 Source: Bloomberg, 2000 Election Period highlighted
But if we zoom out and put the election period into perspective…
S&P Performance 2000-2002

Source: Bloomberg, 2000 Election Period highlighted
So, indeed, the S&P declined 5% during this period of uncertainty (side note: the original piece highlighted a 11% drop in the period of uncertainty – while worse, it doesn’t change my narrative – plus to get a drop of 11% you have to include to the 18th of December, 5 days after the concession). And while 5% is not great performance, it is hardly a left tail event (incidentally, neither is 11%). In fact, if we assume that the volatility of the S&P was about 20% at the time with an expected annual return of 8%, a 5% drop over 25 days is a perfectly ‘normal’ result (and so is an 11% drop over 30 days).
And by selecting the image in the first graphic, it certainly looked like the market was on it’s way up at the time, and that the election caused the sell off. But the second graphic shows that there was already a decline prior to the election. In fact, from the September pre-election peak to the day of the election, the S&P fell more (5.8%) than it fell in the period of post-election uncertainty. None of this is to say that the election didn’t contribute to the sell off at all, I am sure the uncertainty wasn’t welcomed by the markets. But there was a lot more going on in the 2000’s than the presidential election.
If you are old enough to have invested during this time and remember classic stocks like Pets.com and their outstanding Superbowl commercial which aired in January 2000, you will know that the S&P wasn’t the story in the late 1990’s early 2000’s. The Nasdaq was.
So if we look at the Nasdaq, we will find that it was down more than 17% during the post-election period. Now that’s a big drop, so maybe they have a point.
Nasdaq Performance During the 2000 Election Uncertainty
 Source: Bloomberg, 2000 Election Period highlighted
Except that the Nasdaq had dropped 32% from the 2000 peak to the election. And would fall a further 60% after the election for a total decline of almost 78%. So I am not convinced that the election was the source of uncertainty for the Nasdaq. Adding to the Nasdaq volatility on November 7, 2000, the aforementioned PETS.COM announced that they would cease operations, meaning one of the symbols of the excesses of the dotcom boom was going bust, so surely other stocks that were bid up with no revenue and barely an idea were soon to follow. Let’s zoom out again and put that period in perspective.
NASDAQ Performance 2000-2002
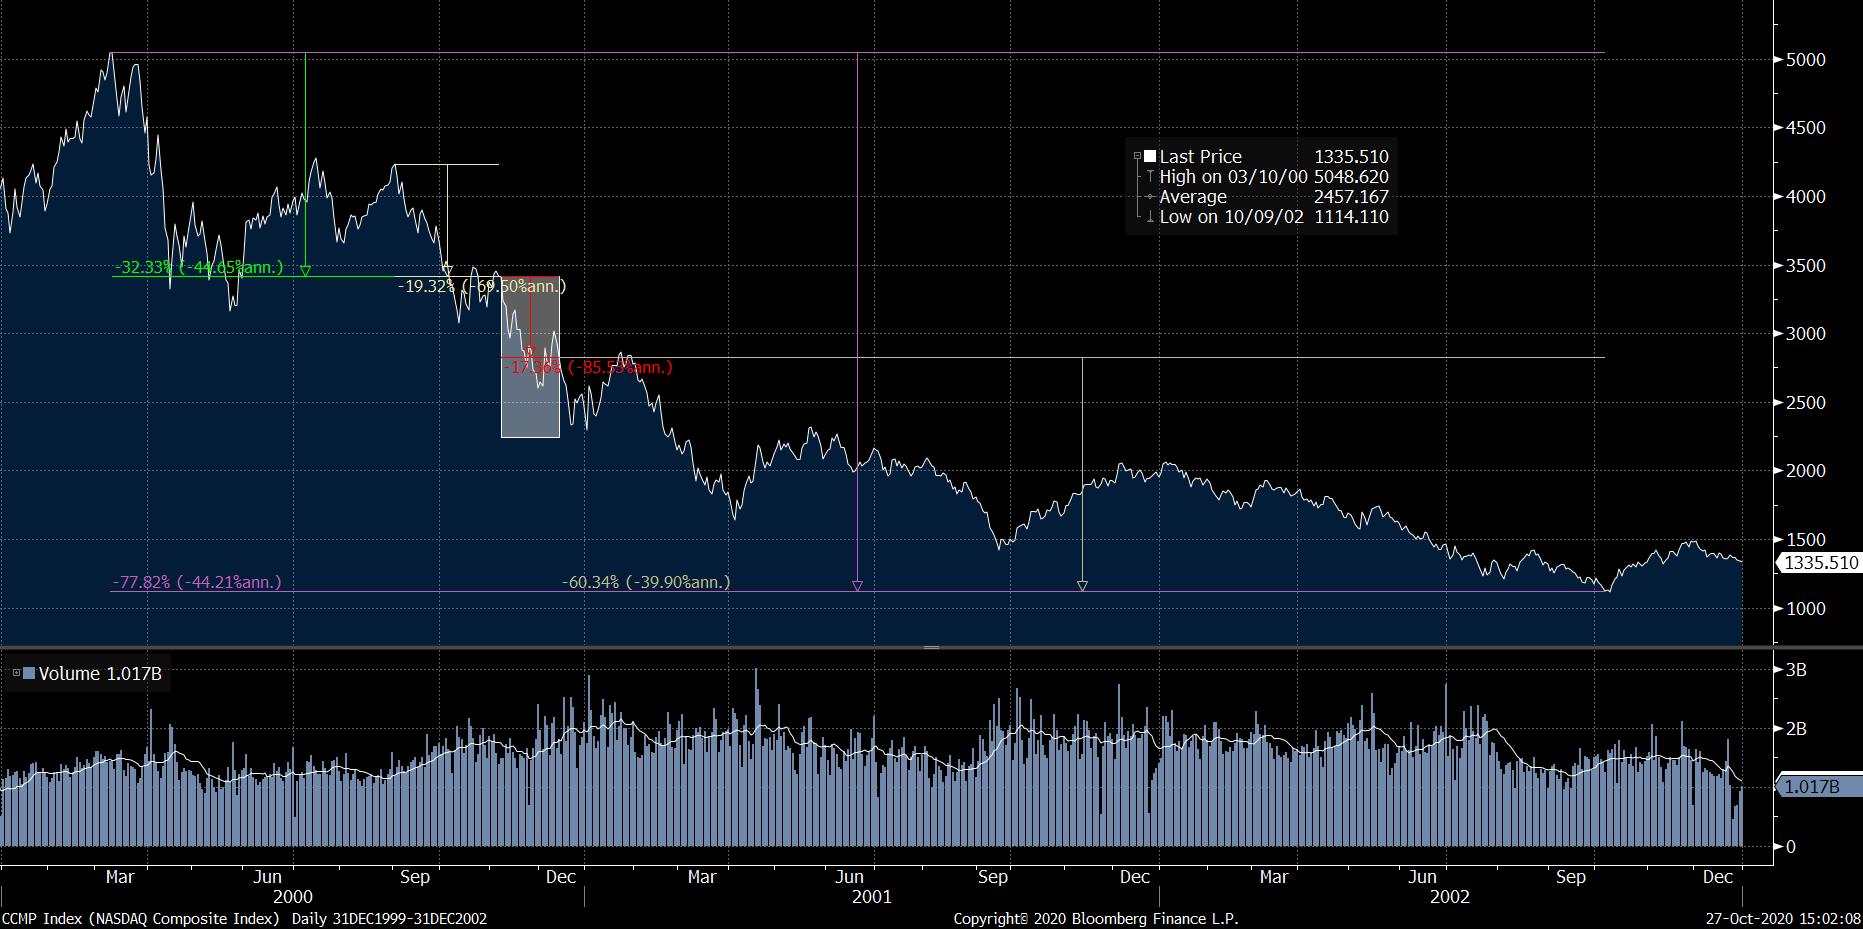 Source: Bloomberg, 2000 Election Period highlighted
Again, I am sure the contested election didn’t help calm investors, it’s just that there was a lot more going on at the time.
Finally, let’s look at the embodiment of market volatility, the VIX. It exists to show how market participants are pricing volatility at a particular time. It must have gone off the rails during this period of uncertainty.
VIX Levels During the 2000 Election Uncertainty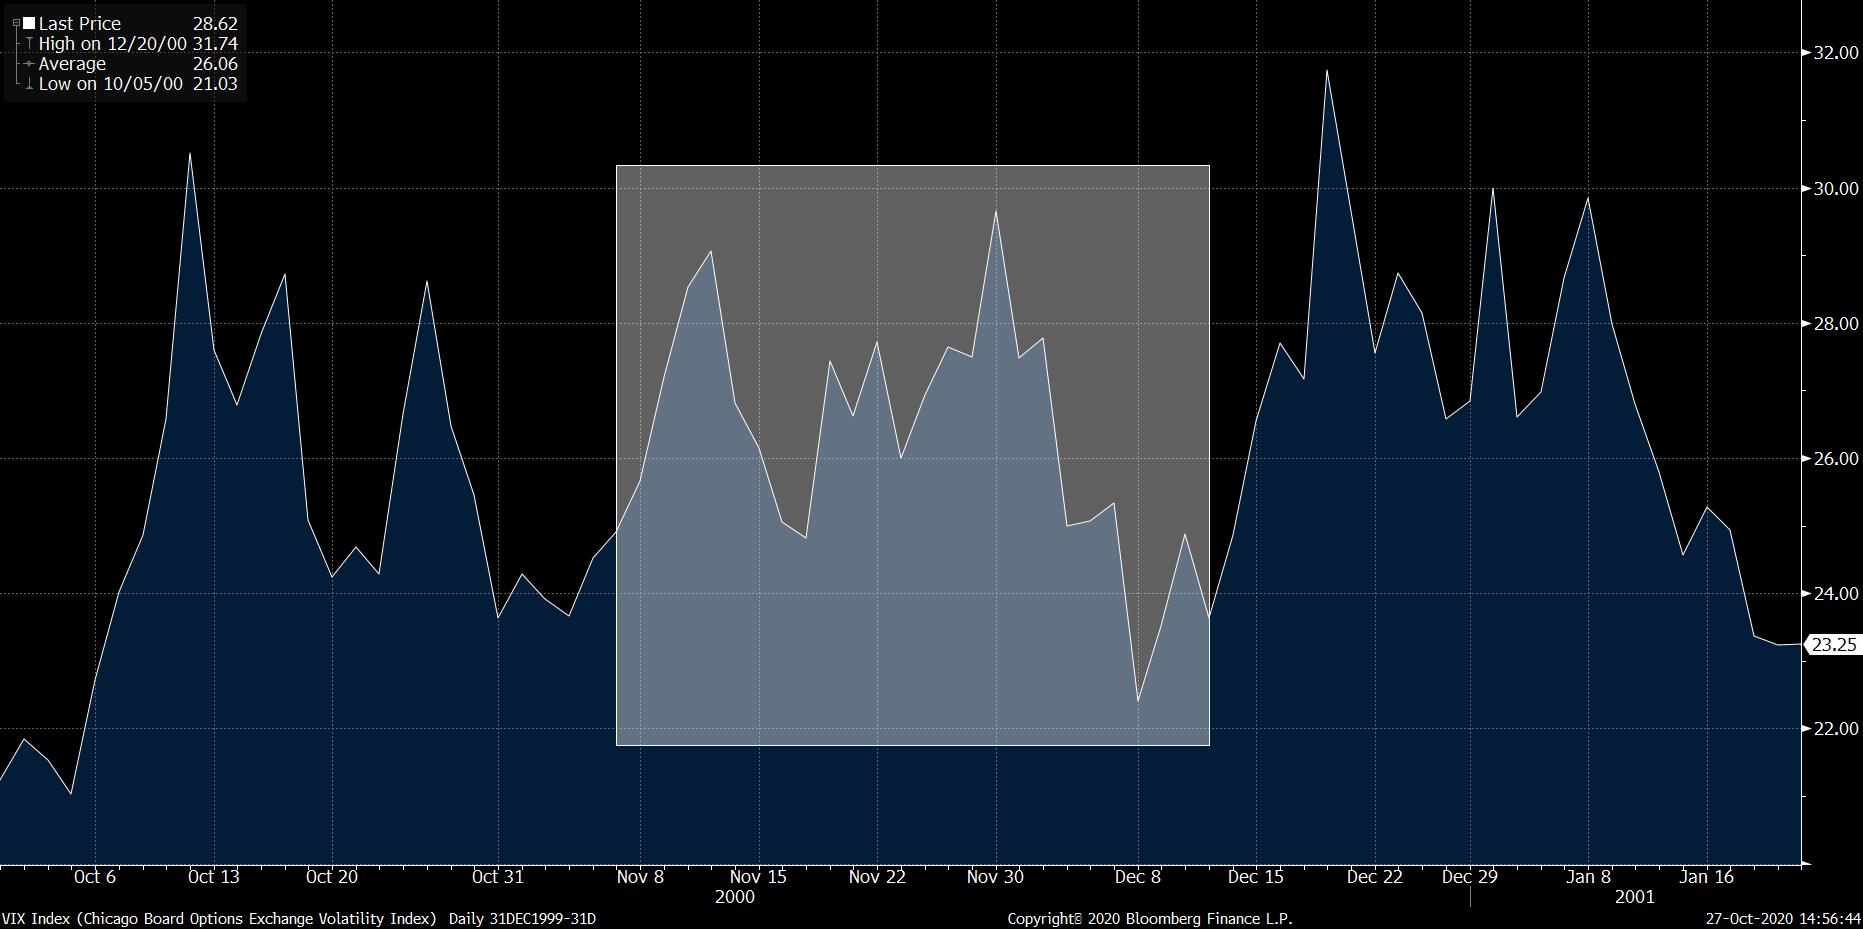 Source: Bloomberg, 2000 Election Period highlighted
Hmm, that doesn’t look so bad. Let’s zoom out again.
VIX Levels 2000-2002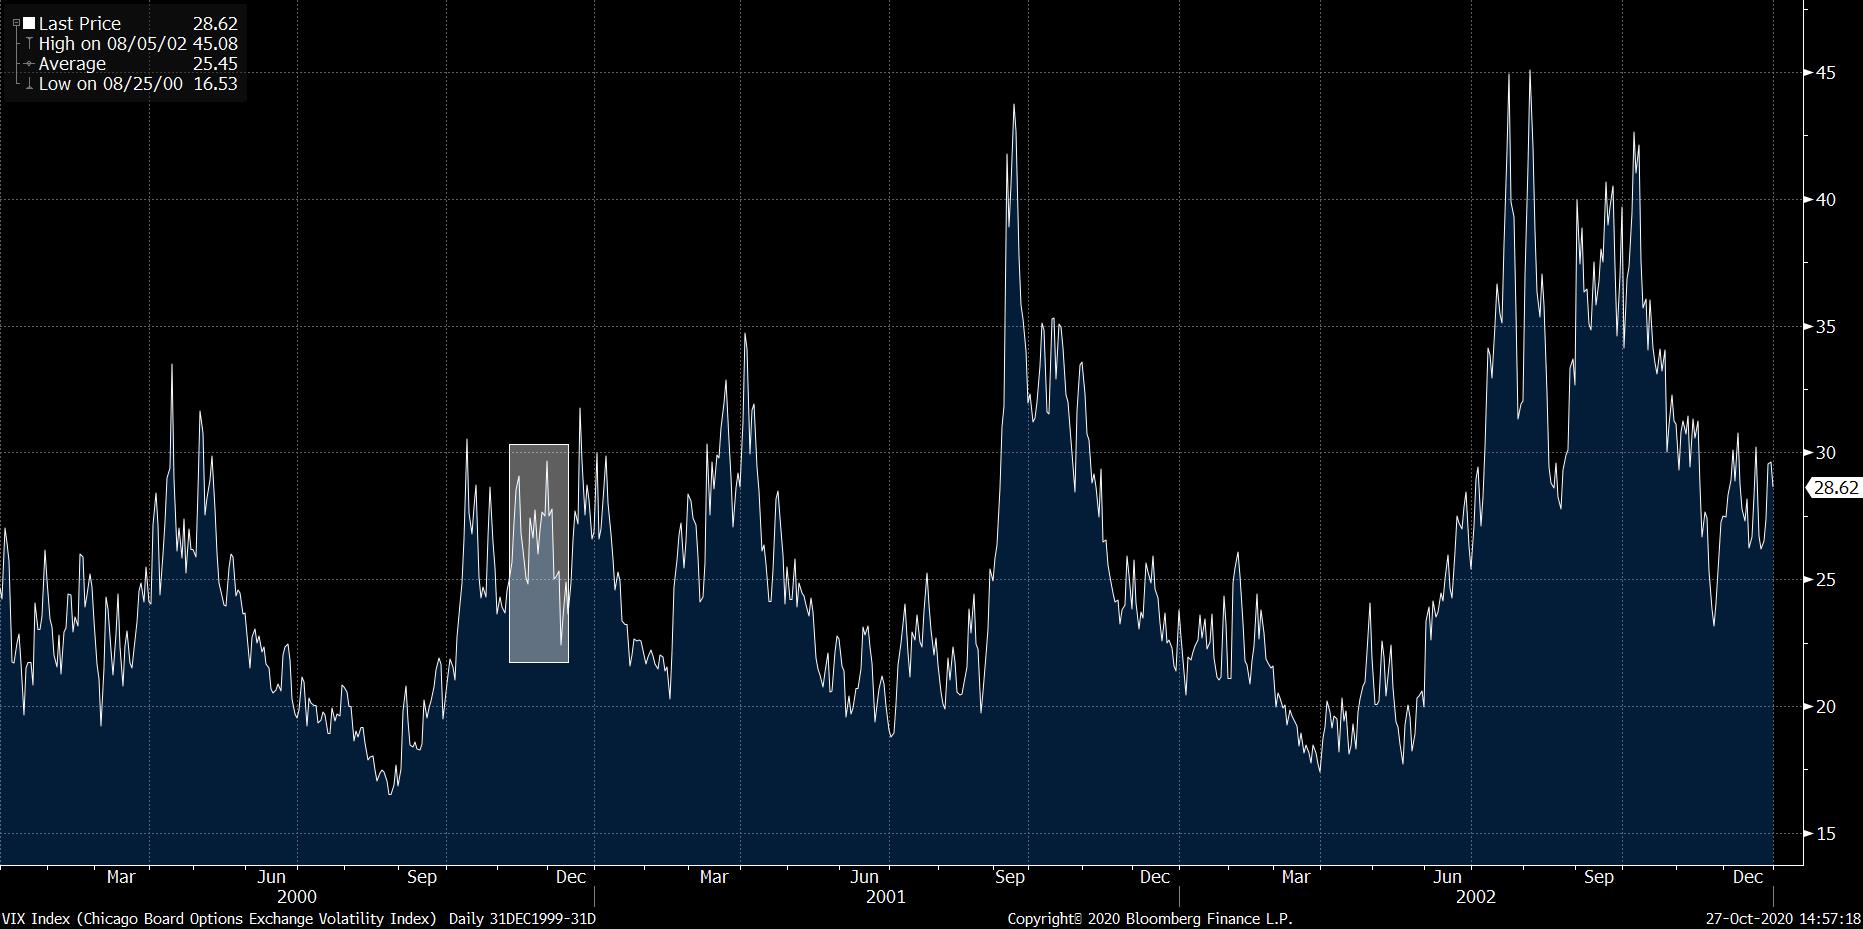
Source: Bloomberg, 2000 Election Period highlighted
You can judge for yourself if the highlighted period would be identified as a market panic. More importantly, you can judge if we should look to the 2000 election as a basis for the type of left tail event that we might see if 2020 is a contested election.
As I wrote on September 11 of this year, if there is a normal transfer of power, markets I don’t think markets would too rattled. What will rattle the markets is if something truly abnormal happens with the election. That is where the left tail risk could come in to play.
And this is my point – if you want to say that there are reasons to believe that a contested election represents significant left tail risk in 2020, great. Tell me why, present an argument with well researched rationale. Or tell me that this could be a truly unprecedented event that will result in drastic market losses. But don’t point to the last time it happened and say “look, see it went down there too!” while cherry picking your data. Lazy, lazy, lazy.