
- Average Employer Contributions / Participant
- Percent of Retirees:
- The Quintessence of Larkspur Executive: Overall Plan Rating
- The differences between benchmarks
- Benchmarking by the state is useful when prospecting in rural areas
- The Business benchmark can be too small for niche plan sponsors
Often our users ask us to clarify the many ratings provided by Larkspur Executive. We get it. It is important to know these ratings in and out so that you can confidently explain the reasoning behind them to clients. Here’s a rundown of the Larkspur Executive ratings.
The benchmark ratings are a quick way to assess how a plan scores when compared to 1000s of similar plans. A plan’s rating is useful for providing context to its key metrics. A plan may have had a rate of return of -3% in 2018, but it is difficult to know if that is good or not. A quick comparison to a -6% benchmark average tells you that the plan is better than most. We ranked all plans within a 0-100 to determine the difference between the plan and an average. So, if the plan’s rating is 85, then you know that only 15% of other similar plans had a higher rate of return.
Instead of telling a plan sponsor that their amount of contributions are poor, you can tell them that compared to their peers they are ranked in the lowest x%.
Now let’s dive into each rating.
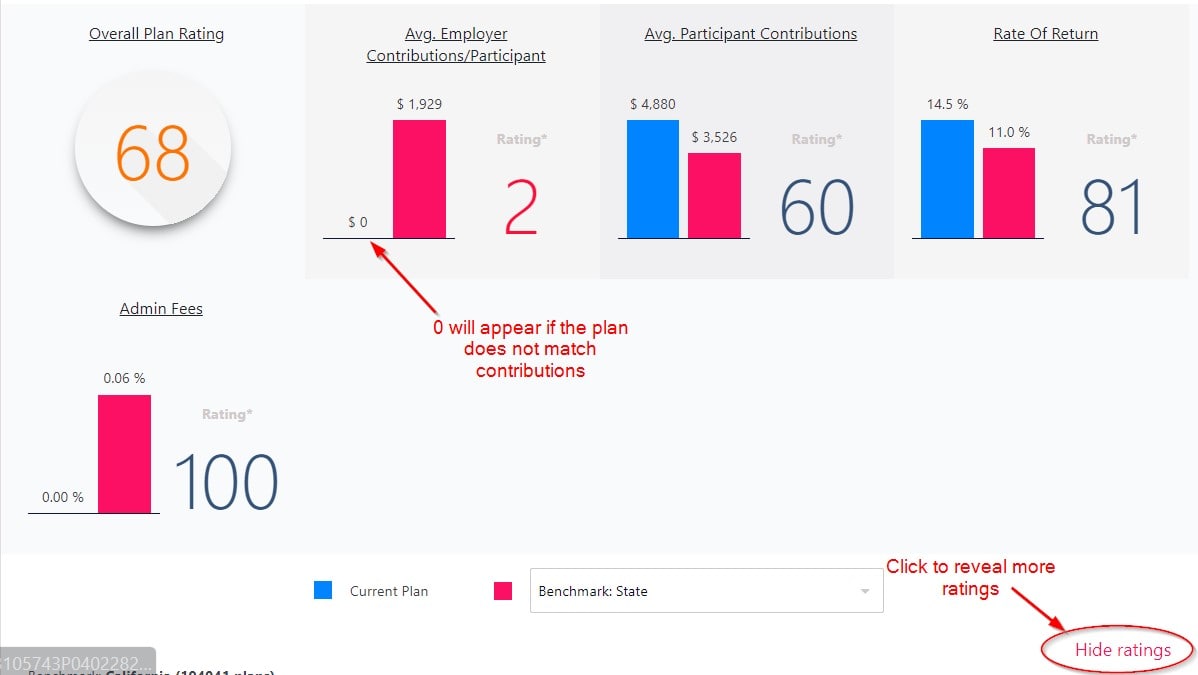 Figure 1: Larkspur Executive has many ratings for each plan sponsor
Average Employer Contributions / Participant:
As we discussed previously on our blog, “Why are Participant / Employer Contributions important to a plan sponsor?”, there are many reasons why plan sponsors will want to boost participant contributions. Put simply, the executives’ 401k contributions are limited by the plan’s participation rate and could be leaving money on the table if their existing financial advisor is not marketing effectively to boost this rate. This rating will show “$0” if the plan sponsor does not make any matching contributions (Figure 1).
Percent of Retirees:
An understanding of the proportion of withdrawing participants in a plan is essential to understand the goals of the plan sponsor – growth or income. This rating shows the number of participants who are withdrawing from the plan. Although, it does not factor in the Overall Plan Rating and may not be rated if the number is not provided in the 5500.
Admin Fees: Rixtrema was practically founded around a mission to make plan sponsors aware of excess fees – a white paper inspired our 401k Fiduciary Optimizer financial planning software. Our clients frequently report that the Admin Fees rating shocks plan sponsors during meetings. (We wrote before about how to find plans with the highest admin fees.)
Rate of Return: The rate of return rating is a comparison of the total change in the size of the plan’s assets due to investment income and capital appreciation. We do not include contributions or distributions in the rate of return calculation because they do not contribute to the portfolio’s performance.
The Quintessence of Larkspur Executive: Overall Plan Rating
The Overall Plan Rating is calculated by the average of all the other ratings. Like the rest, it is a percentile rank compared to plans in the selected benchmark. It is calculated by averaging the other ratings, except Percent of Retirees. If there are any Top Fiduciary Risk Factors that exceed 5 (Figure 2), then it will be deducted more.
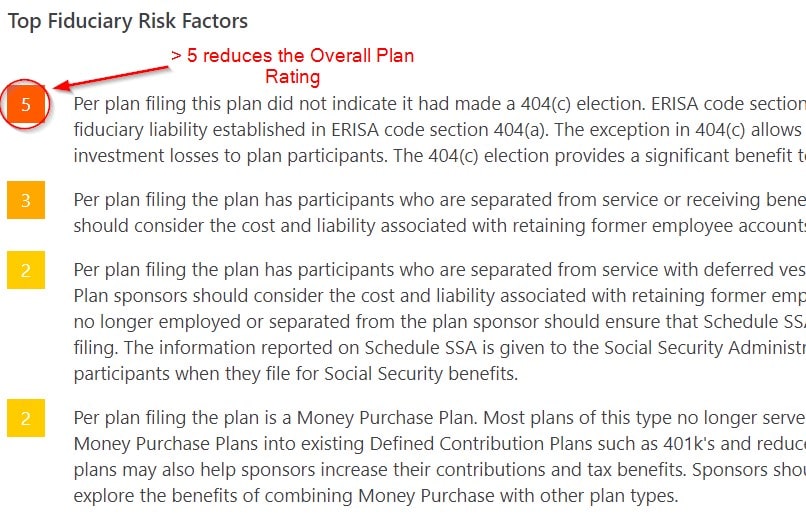
Figure 2: Any Risk Factor greater than or equal to 5 will reduce the Overall Plan Rating
The differences between benchmarks
Every rating, except the overall rating, is relative to one of 3 benchmarks. The most reliable ratings are bench-marked to thousands of similar plans, so it is important to note that the comparison size will change (Figure 4). You can click on any one of the ratings to create powerful benchmarking charts that illustrate the percentile ranking and distribution (Figure 3). (We discussed those charts previously on our blog.)
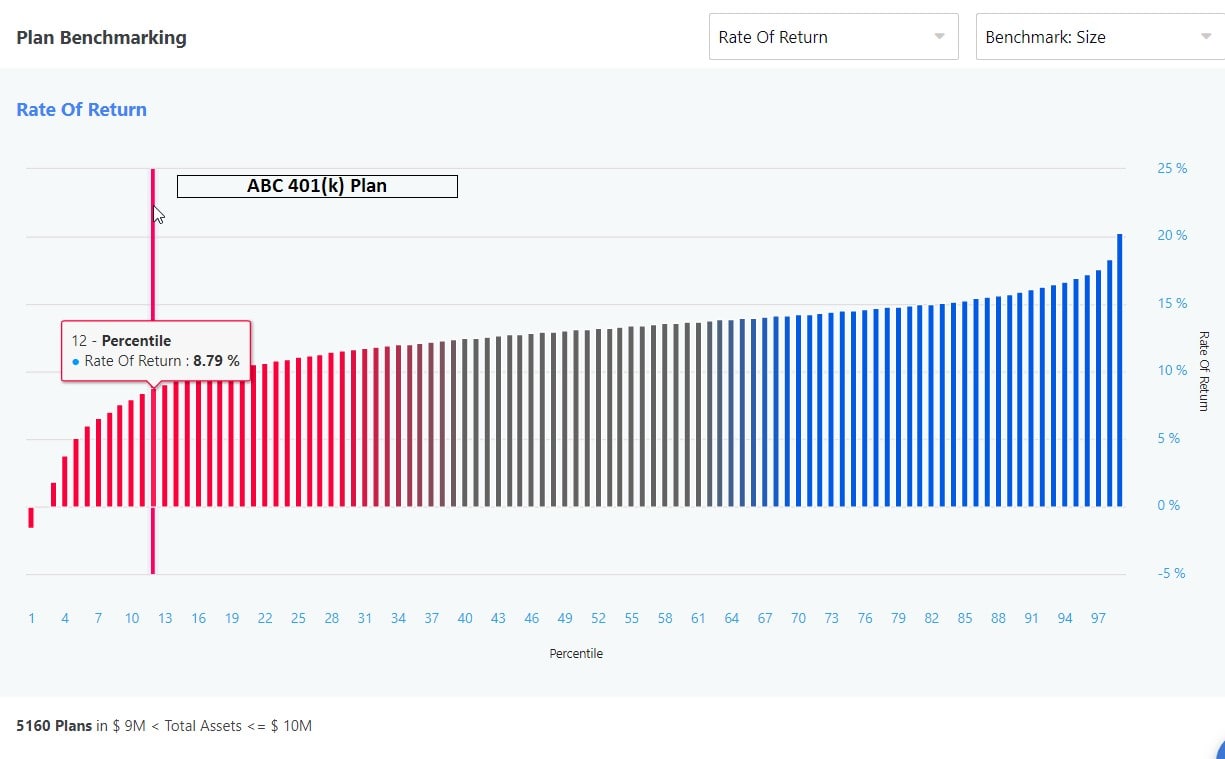
Figure 3: Click on any of the ratings to see a graph and better understand the distribution

Figure 4: Choose benchmarks with thousands of similar plans
Benchmarking by the state is useful when prospecting in rural areas
When prospecting sponsors in rural areas, comparing plans within the state may give a more relevant context. Area-specific demographics, though, may make the rating misleading if the comparison is made to businesses within a contrasting population. The plan conditions of a New York company are not the same as Beaumont, Montana.
The Business benchmark can be too small for niche plan sponsors
Each benchmark pulls information from the vast Larkspur Executive database. If the 5500 document identifies the plan sponsor as part of a niche industry, then benchmarking it to other businesses is not wise because the sample size will be very small. Instead, the asset size benchmark can be a more adequate contextual reference for the portfolio’s performance and fiduciary advisor’s actions.
You can read more about the features in Larkspur Executive and the rest of our financial planning software platform at our blog, rixtrema.com/blog. You can also read our analysis of markets and current events and subscribe to our newsletter. If you have any questions about any of our software, then please contact our Client Success Team at clientsuccess@rixtrema.com.