I recently read that one could predict a downturn in the S&P by observing the shape of the VIX futures curve. Or, more precisely, when the VIX futures curve is in backwardation, it portends a decline in the S&P. So, is this true? Read on to find out.
In case you aren’t a futures trader, let’s quickly review some terms. First, the VIX is a measure of expected equity volatility. It is used in the pricing of options. If one is trying to get protection against an fall in the S&P by purchasing a put option, a higher level of volatility as measured by the VIX would indicate that protection is more expensive than when the VIX is at a lower level. As a rule of thumb, think of levels below 20 on the VIX to be relatively low and above 20 to be relatively high.
“Backwardation” and “contango” are terms that describe the shape of a futures curve. Contango is the ‘normal’ upward sloping curve, while backwardation is a downward sloping curve. Contango is the harder one to remember (for me at least), as it is basically a nonsensical word. But if we can trust Wikipedia, they say the term contango “…originated in 19th century England and is believed to be a corruption of ‘continuation’, ‘continue’, or ‘contingent’.” A term used in place of contango is forwardation, essentially the opposite of backwardation. While forwardation has never really caught on, it is a helpful mnemonic.
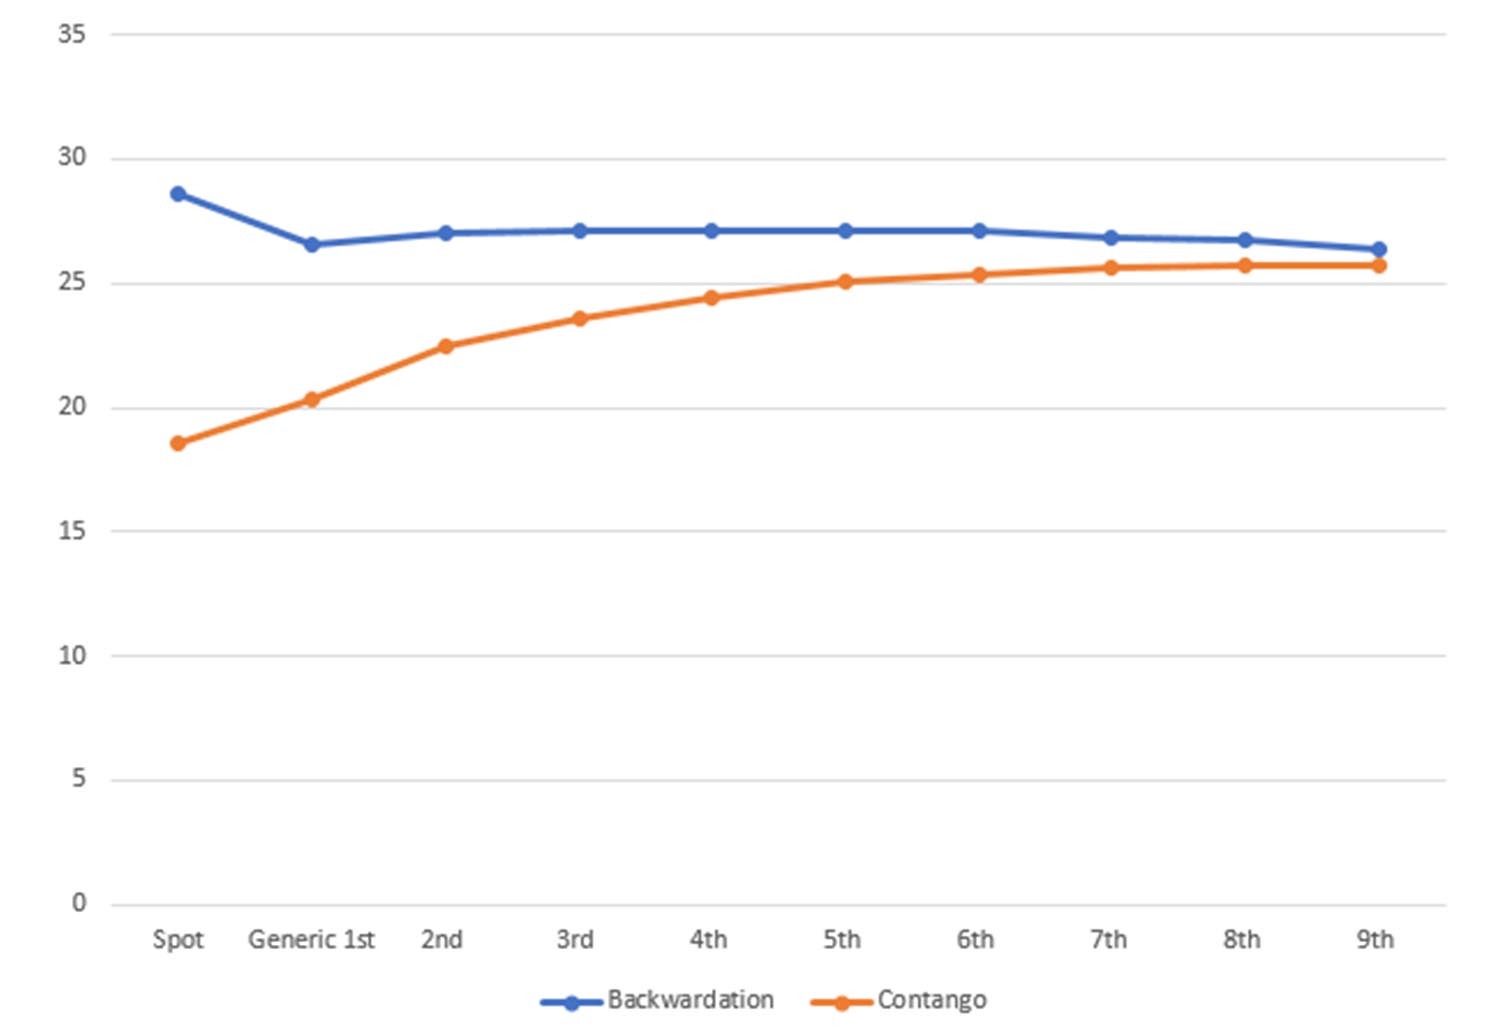
The easiest way I found to remember the difference is that when the futures curve is in backwardation it is backward – that is the opposite of a normal upward sloping curve. That normal upward sloping curve is contango (forwardation). Below is an example of the VIX futures curve in backwardation and contango.
Source: Bloomberg
Note that these examples are from the day before Thanksgiving (November 24, 2021), and the day after Thanksgiving (November 26,2021), which are the days that gave rise to the topic of this blog. The designation of Generic 1st through 9th is simply noting the 1st contract expiration, the 2nd contract expiration, etc. The example above the 1st expiration is December 2021 and the 9th is August 2022. These roll in a continuous series giving us a historic representation of the shapes of the curves at different points in time.
Since volatility and time are the key inputs in pricing equity protection at a certain level, the VIX can be used to help determine how expensive (or cheap) S&P options are. Typically, the more time that the protection covers, the more uncertainty. This is why the VIX is usually in contango – more time means higher potential for pricing variability which means a higher implied volatility in pricing the options, and thus the expirations further out are higher than those closer to expiration.
But when the VIX curve is in backwardation, this means that the near-term has relatively more uncertainty than the long term, and thus the level is higher than the long term. Backwardation implies that hedging near term market uncertainty deserves a premium relative to longer horizons (note that this does not necessarily mean that a short term option is more expensive than a long term in absolute terms because the time component is a big factor in pricing).
This is why when the VIX curve switches from contango to backwardation, traders generally take this as a bearish signal. And this really can’t be disputed, because almost every bad day in the S&P sees the curve in backwardation. If we define a bad day as the S&P falling 2% or more, these days see the market in backwardation about 86% of the time (since the beginning of 2006). The near-term uncertainty from a big downward move necessitates traders demand a premium for near-term protection.
But can the shift in curves be used to predict a market downturn or is the shift just a reaction to the current price action? To test this, I ran a simple experiment using a portfolio that is 100% invested in the S&P 500. When the futures curve switches from contango to backwardation, sell all the S&P 500 shares and hold 100% cash (0% return). For this experiment I will assume I get the close on the day of the curve switch and that there are no transaction costs or taxes.
Like many other buy/sell rules, the result really depends on the period that it is run. If we go back to 2006, the result will largely depend on if we get out of the way of the 2008/09 market crash. Since this strategy did manage to get out of the way, it looks like a resounding success. As shown below, our portfolios start with $100, and you can see that the Buy and Hold portfolio underperforms the Backwardation Trade portfolio by a large margin ($367 ending value vs. $555).
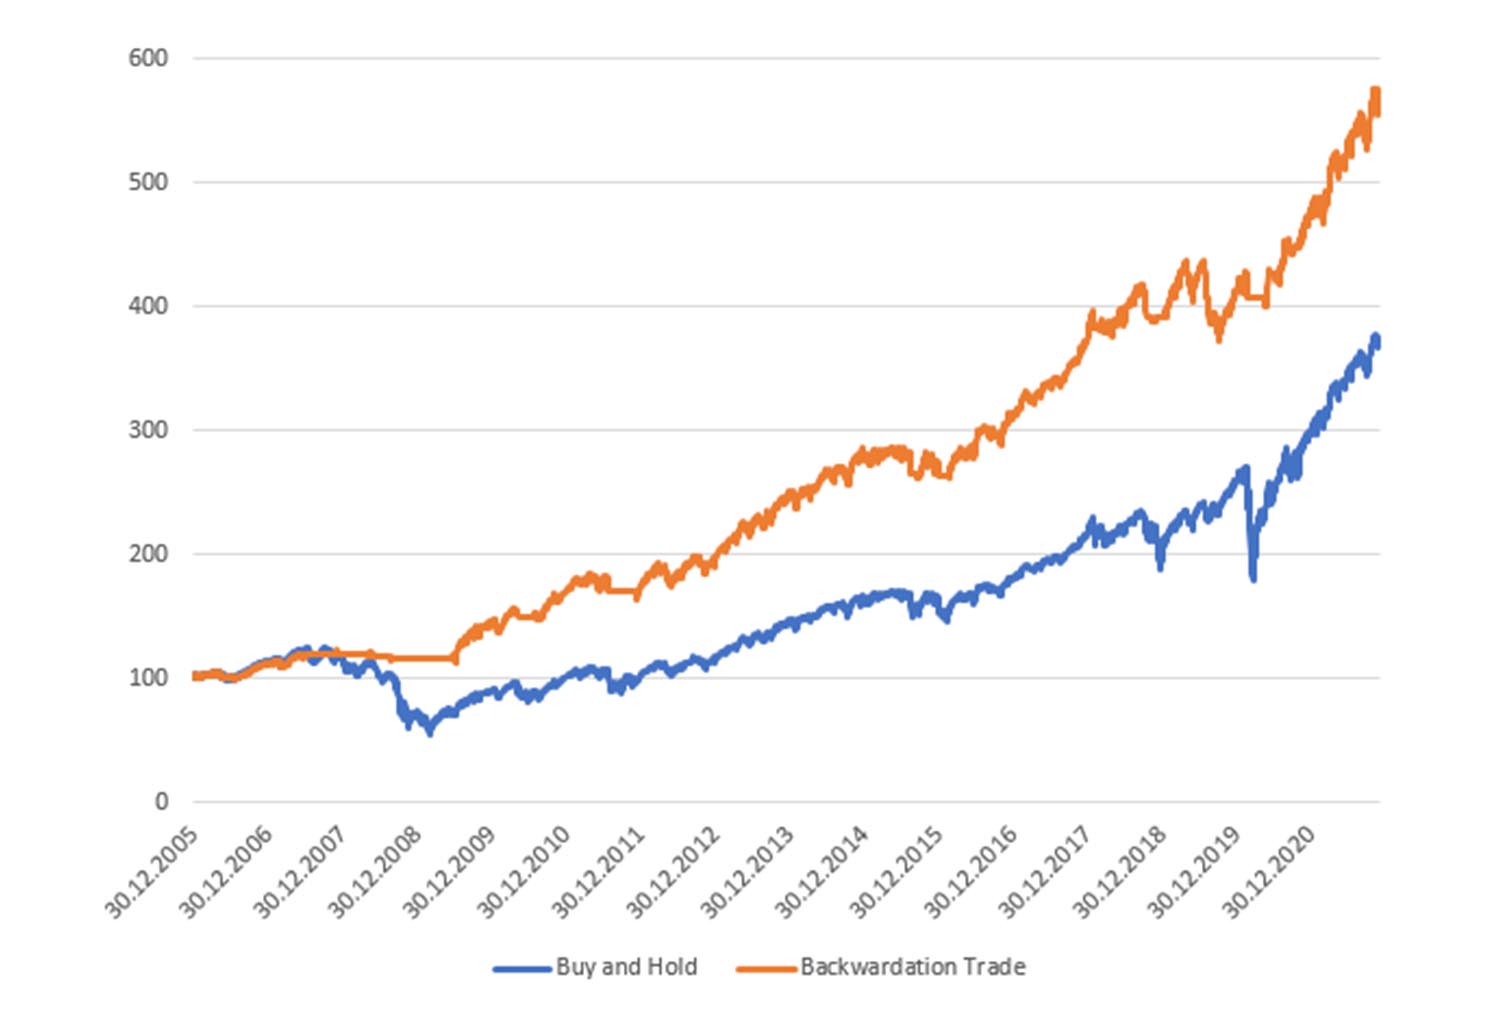
You can see the difference trading out of the S&P ahead of the 2008 market crash makes for the Backwardation Trade portfolio by observing the flat orange line in that period. As with many quantitative strategies, getting the market crash right can distort the success metrics.
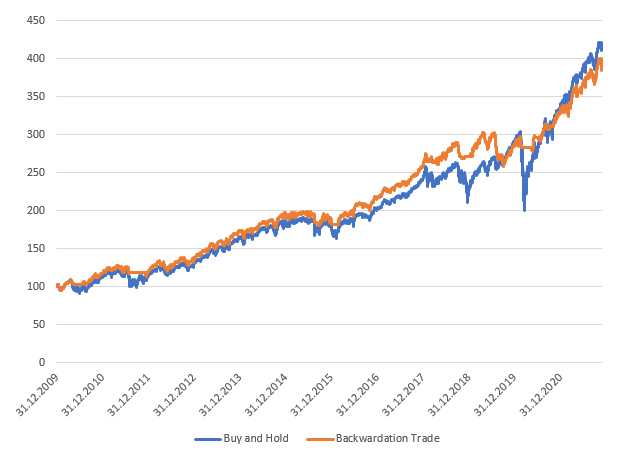
If we start after 2008, let’s say at the end of 2009, the story is a bit different. The Buy and Hold slightly outperforms during this period (though remember, we are ignoring taxes and transaction costs, so the underperformance of our Backwardation Trade strategy is likely significantly understated). But importantly, the Backwardation Trade gets out of the way of all of the steepest drawdowns.
The bottom line is that there is information in the futures curves. While it may not be a practical trading strategy, using the curve as an entry and/or exit data point may help timing some portfolio trades that you may be considering anyway. For example, if you are considering increasing a client’s equity allocation but the futures curve is in backwardation, it may make sense to wait until the curve resumes its normal contango shape before increasing your client’s allocation.