
More on Riskalyze interest rate stress tests & ‘wildly inaccurate’ predictions?
Yesterday, Riskalyze published some attacks on methodologies of their competitors, specifically RiXtrema and Hidden Levers. The day of the article, we received an inquiry from a journalist at wealthmanagement.com. Here is the key question we got asked and our answer:
Journalist: How would you respond to criticism that labels Portfolio Crash Testing PRO as “predictive guesswork” and “wildly inaccurate?”
RiXtrema: Well, our scientific credentials speak for themselves. Also, a previous version of our methodology was published in a well known scientific journal called Journal of Risk Model Validation (https://www.risk.net/journal-of-risk-model-validation/2161275/portfolio-crash-testing-making-sense-of-extreme-event-exposures). RiXtrema’s latest version of PCT PRO is significantly more advanced building on the same foundation. So, the previous version of the model that is currently running in PCT Pro was published in a peer-reviewed academic journal with validation results that are replicated by reviewer scientists. That would mean that a critic has to provide quantitative evidence of bombastic claims such “wildly inaccurate” etc by, for example, disproving the results from the above academic paper. Otherwise, we have substantial published scientific evidence to call them to task for such dangerous and unsubstantiated claims.

Second, all predictions involve uncertainty. Can you tell me what the market will do next year? Of course not. If the implication contained in “predictive guesswork” is that there is no thought put into our scenarios, I would argue back strongly. Whenever we publish a new scenario, we explain our thought process behind the factor stresses in that scenario. Advisors can accept, reject, or alter those assumptions to create their own scenarios. But, I would emphasize that using our tool does not depend on the accuracy of a specific scenario. So I guess we are not quite sure how to respond to hyperbole like “predictive guesswork” and “wildly inaccurate” without any evidence except to say we have plenty of data that proves otherwise.
But the story does not end there, or more precisely, it does not start there. As some may remember, several years ago, in 2014, we wrote an article in Advisor Perspectives questioning very strange risk modeling results published on a Riskalyze blog. Curiously, the original blog post is now removed from the Riskalyze website, see here, it gives a 404 error:
http://blog.riskalyze.com/post/53182351760/turning-finras-directive-about-bond-market-risk
But internet remembers everything, and here is the link to the original version of the Riskalyze blog from the Wayback Machine https://web.archive.org/web/20151023045316/http://blog.riskalyze.com/post/53182351760/turning-finras-directive-about-bond-market-risk#_=_
Anyone can read what their model actually predicted and how wildly inaccurate it turned out to be. Back then we wrote a more extensive response, but due to the highly personal nature of attacks decided not to continue the spat. However, given that Riskalyze decided to attack us yesterday, it is fair game to publish our analysis. Here it goes below:
Let’s delve into completely the unrealistic results that were published by Riskalyze about their interest rate stress test. They found a portfolio with duration of ~6.2 and a 38% equity position to have ‘dramatically increased risk’ in a 1% interest rate rise scenario. Specifically, Riskalyze wrote:
“ A 1% increase in interest rates increased the portfolio’s net risk by more than 70%.”
How can you say that the risk of portfolio with duration of 6.23 and a 38% stock position goes up “dramatically” in a 1% interest rate increase?
Interest rate stress tests always and everywhere work with a measure called duration. Finance courses in college start with duration and the most sophisticated traders use the same duration concept. Riskalyze interest rate stress test does not even mention duration. Their original article comes to the conclusion that “…that a 1% rise in interest rates has such a dramatic impact on downside risk is often eye-opening.” But we are talking about a portfolio with duration of 6.23. So, if we only talked about the bond position, it would lose 6.23% (and if we account for convexity as we should, it would lose less, because convexity helps whether rates fall or rise). Of course, a 6.23% loss doesn’t sound as dramatic as the dubious 70% increase, but it is the simplest and most accurate answer.
In addition to a 6.23 duration, the portfolio in question contains a 38% stock position (Vanguard Total Stock ETF plus Apple), which will likely go up when rates do (rates and stocks have a fairly strong positive correlation). How can you ignore the correlation between interest rates and stocks when you are performing stress tests? Has this methodology been backtested in any scientific publications?
We have done risk modeling for our whole professional careers. Questioning each other’s math in a public forum is absolutely normal. It benefits the public and even the providers as it forces them to be rigorous. That is, of course, if the discussion is substantive and mature.
Instead of publishing a rebuttal explaining their interest rate stress test methodology, Riskalyze unleashed a storm of personal sarcasm on Twitter calling us ‘wannabes’ and ‘would-be competitors’. But no substantive information or quantitative/financial arguments came forth.
After unleashing this firestorm, Riskalyze suggested that they will not tell anyone how Riskalyze numbers are calculated without a Non-Disclosure Agreement. Since Riskalyze does not explain how their model is calculated and does not provide backtesting results for their interest rate stress test, we ran some numbers for the portfolio that Riskalyze used in their original stress test. For the data we used Robert Shiller’s database with stocks and rates going back to 1870’s.
The results are in and we are not asking for any NDA to reveal them, because information wants to be free. Methodology: We looked at all periods starting from 1872 when interest rates rose between .5 and 1.5% (181 data points). This is not conjecture, but actual data. To mimic the Riskalyze stress test we took all 12 month rolling periods where US 10 Year Rate went up between .5% and 1.5%. We calculated the actual return for the Riskalyze published portfolio that had ‘dramatic’ increase in risk in a 1% rate rise. The actual average return for that portfolio in moderate rate up environment is +1.09% ! The original article by Riskalyze stated that “…seeing that a 1% rise in interest rates has such a dramatic impact on downside risk is often eye-opening”. Well, this portfolio actually gains on average when rates rise. In our original critique we said that portfolio with duration 6.2 and 38% stock equity position would be between 6% down and mildly positive. And that is in fact what we are seeing. Below is a chart showing all periods when the 10 year rate in the US went up between .5% and 1.5% on 12 month rolling basis. We reconstructed Riskalyze ‘dramatic’ rate risk portfolio and added the S&P 500 return during the same periods. Note, that most of the time the portfolio is actually positive when rates rise (102 out of 181 periods). But the most important observation is the portfolio return is not driven by bonds at all. The 38% stock positive swamps or at least mutes rate impact. The correlation between Riskalyze ‘dramatic’ rate risk portfolio and the S&P 500 is .93!
Even when the portfolio is down when rates are up (which is rare), it is down not because of bonds, but because stocks are down. So, the whole stress testing exercise that Riskalyze has performed is irrelevant because it ignores the impact of equities in the rate rise environment.
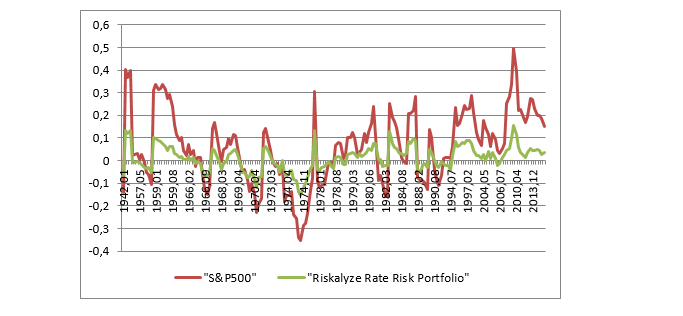
Conclusion: So, this was Riskalyze saying that 1% increase in interest rates dramatically increases the risk of a portfolio with duration of 6.23 and an equity position of 38%. We argued that they are completely wrong. But a few years have passed and we can for sure just who is ‘wildly inaccurate”.
The chart below that in 2016 and 2018 rates went up not 1%, but almost 2% by 2018. Did that really cause massive losses to such a portfolio?