When Wasteful Plan Fiduciaries Tell You That Savings You Propose Are Not “apples-to-apples”
When it comes to bringing a needed change to a retirement plan, there will usually be a fair amount of push-back from the third-party administrator or a plan’s record-keeper or current plan fiduciaries.
Advisors using the 401kFiduciaryOptimizer quant analysis tool can analyze any 401(k) plan and visually see how much the plan can save by replacing expensive funds with highly similar less expensive vehicles. But the question of revenue sharing inevitably comes up and some plan fiduciaries think they can use opacity of rev sharing arrangements as defense against much needed plan optimization. When presented with an optimized plan proposal, a plan sponsor will likely push back saying that the analysis is not ‘apples-to-apples’ because expensive funds are paying for other expenses in the plan through revenue sharing. We can use 401kFiduciaryOptimizer to point out the flaws with this argument.
To analyze the funds in a plan, we look at various factors with a set of assumptions to account for these unseen fees. By default, all plans that are analyzed will have the assumption that revenue sharing is equal to 12b-1 fees. This means that any suggested savings are reduced by the amount of 12b-1 fees (if we replace a 1% fund that has a .4% 12b-1 fee, we assume that its cost was only .6% to the plan). With this assumption checked, we are trying to give the current plan and its TPA the best chance possible for a fair comparison. Even though we may not know the true revenue sharing or combined expenses, we use this setting to account as much as possible for savings to the plan participants. If a plan sponsor truly wants to do the right thing by participants, they can easily provide the exact revenue sharing numbers to the advisors (when different from 12b-1 fees) and advisor can use 401kFiduciaryOptimizer to create detailed analysis. However, if a plan is wasting .5% per year with assumption of 12b-1 fee as revenue sharing, it is highly unlikely that custom revenue sharing arrangements will bridge this gap.
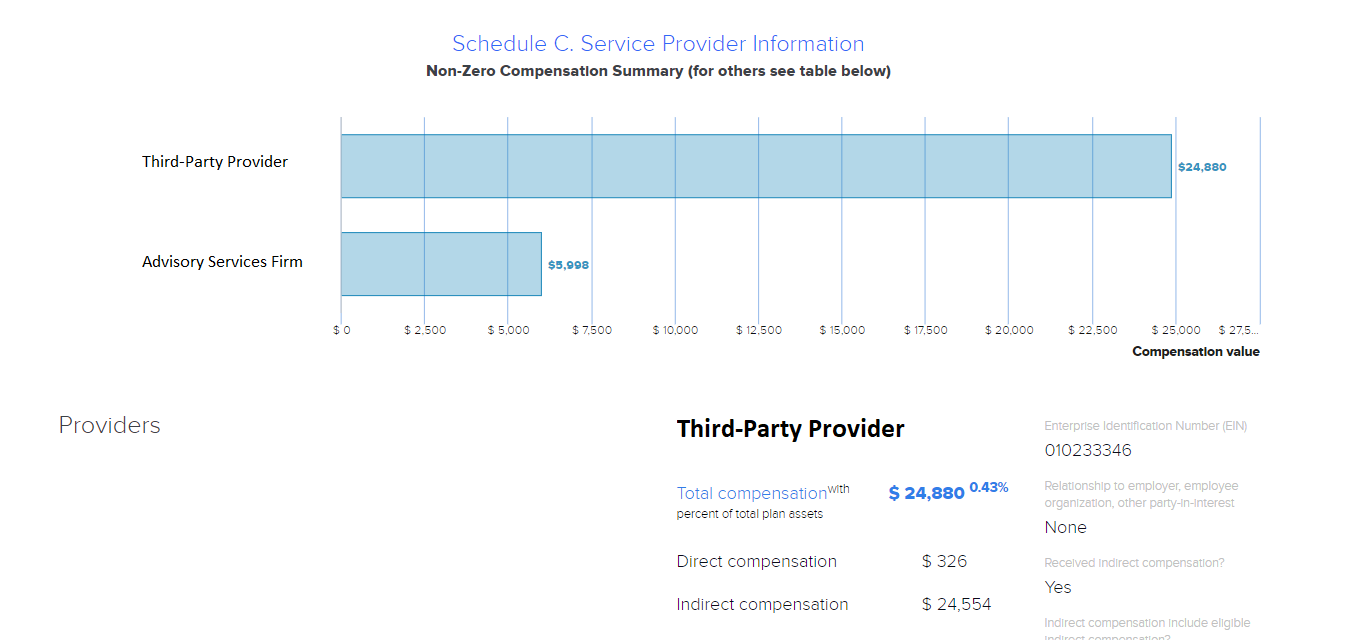
But even some of the opacity of revenue sharing can be reduced by using Schedule C data from the form 5500 filing. Using the 401kFiduciaryOptimizer we can check the “Providers” menu and see how much direct and indirect compensation a third-party provider is receiving from their form 5500.

(Figure 1) Schedule C information as displayed in 401kFiduciaryOptimizer
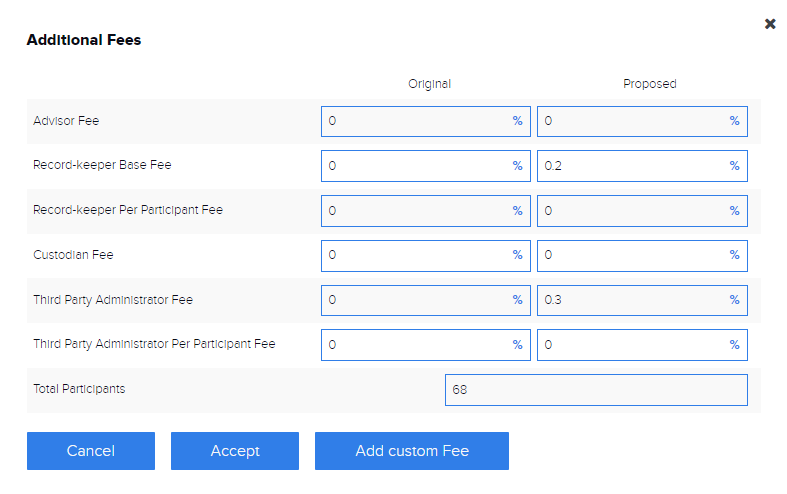
On this plan, we can see that the Sample Provider (the name of the company is hidden) is receiving over $24k in indirect compensation per year. We can use this data in our 401kFiduciaryOptimizer report to demonstrate to plan sponsors how much they can save on their plan even adjusting for approximate revenue sharing. But we can go further in our analysis. We can enter in almost any kind of fee in both an original and proposed lineup.

(Figure 2) Additional fees menu in 401kFiduciaryOptimizer
We can customize these fees to demonstrate that even including generous amount of revenue sharing, we can still pass on significant savings to plan participants.

(Figure 3) Total Fees for initial and proposed line-ups
We can see in this graph that even with .5% in proposed additional fees (see figure 2), there is an annual savings of over $20k for this $5.7M plan! This can equal huge savings for plan participants, and is a significant red flag for any plan sponsor without those changes. And it is likely even this estimate is way too conservative and savings are really much more significant than presented.
Passive Vs Active Vs “Closet Index” Funds
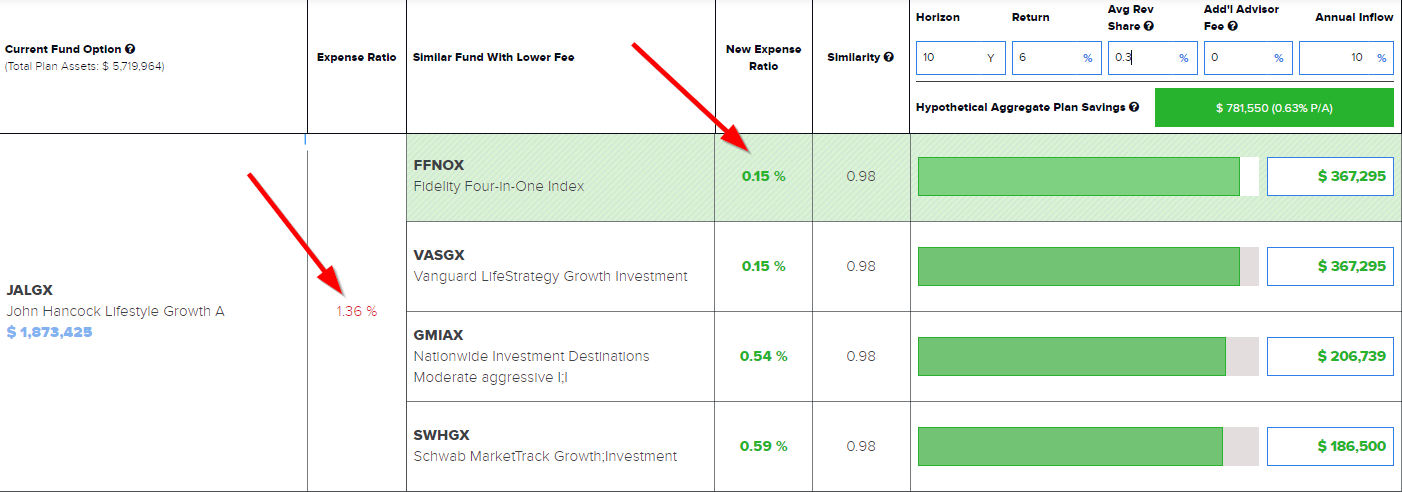
Looking at this plan using the 401kFiduciaryOptimizer, we can see that it contains many funds that are greatly undercut by cheaper funds that have a nearly identical similarity rating:

(Figure 4) Using RiXtrema’s similarity score to find low fee alternative funds
A similarity rating is a type of correlation calculated by RiXtrema that is based off of both fund returns and underlying holdings. A score of .98 in this case is telling us that these funds are virtually identical. We can use this score to identify what we call “closet index” funds. These funds will charge a premium for being active, yet are nearly identical to an index fund. Revealing funds like these in a 401(k) plan can mean huge savings for plan participants.
While a plan sponsor may suggest that active funds should be compared only against active funds, we disagree. We believe that what a fund claims to do is less important than what it does. Said differently, it really depends whether a fund is truly active or simply identifies itself as active while acting like an index fund. By properly accounting for any hidden expenses, advisors can diagnose potential deficiencies of plan menu. This massive cost to plan participants can also be a tremendous fiduciary liability to any plan sponsor. Overlooking wastefulness could prove costly for a plan sponsor in more ways than one. Any advisor can show plan sponsors how much these hidden fees may be costing their participants with the 401kFiduciaryOptimizer!


Luke,
Great breakdown of all the dynamic tools the 401kFO can produce. We’ve found while using the tool that not only does it uncover potential lead sources for plans being over charged and/or fiduciary breaches, but allows us to present a benchmarking type tool once we’ve gathered more information, by inputting additional costs i.e. advisor bps, TPA, RK, Custodian. The tool is an an all-in-one component to be able to capture leads, input data we already have from sponsors and allows us to create a proposal our costs vs their current. It’s Great!
Thanks for the reply, Nick! I’m glad you’ve been able to utilize all of these features I mentioned in the article and it’s been useful in your practice! Our goal is to make the most comprehensive tool possible for advisors working with retirement plans.