There are a few features in the new Portfolio Crash Testing Pro (PCT Pro) that allow an advisor to compare and contrast the outcomes of various portfolio allocations. Some of the most dramatic comparisons come from including assets that feature a non-linear payoff profile when used in stress tests. This post will illustrate a simple portfolio that holds an option. We can analyze other asset types, like structured products and annuities with caps or floors built into their payoffs, in the same manner.
I am going to compare a simple US-based 60/40 portfolio with $1m to the same portfolio with 1% of the equity exposure allocated to an option. Figure 1 shows the holdings in dollars and percentage terms.
For the hedged portfolio, I took 1% of the SPY allocation, or $10,000, and allocated it to an option. I chose a put option of about 14% out of the money (at the time of modeling) that expires in June 2020. The expectation is that I will sacrifice upside in this portfolio if the SPY increases (or falls by less than 10% at expiration) in return for protection against significant declines in the SPY (greater than 10%).
PCT Pro has several ways to look at the portfolio impact of adding this option position. In this post, we will look at one common way to use PCT Pro – a side by side comparison of various scenarios. In the next post, we will examine a brand new feature in PCT Pro called the risk grid.
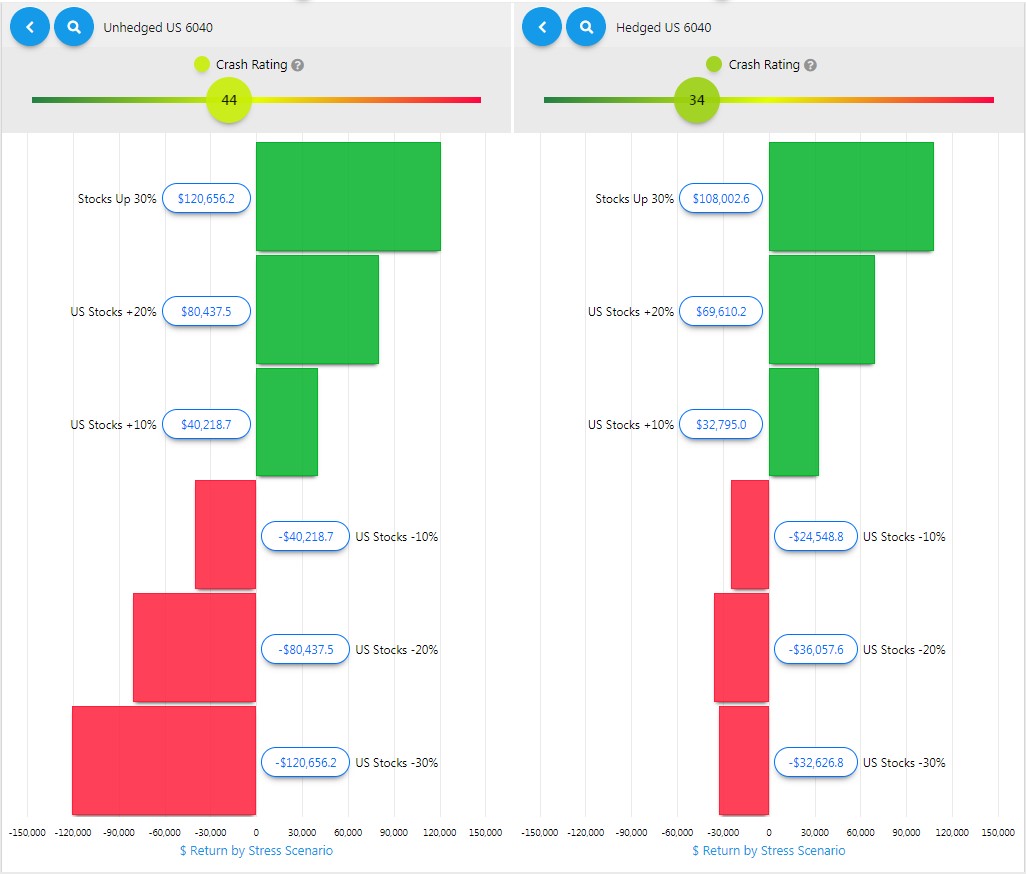
I created several custom scenarios with PCT’s Custom Stress Tests feature to analyze the effect of adding an option to the 60/40 portfolio. This stress test feature will apply various stressors to the US Equity market, our primary risk factor. Figure 2 shows the portfolios side by side for two scenarios – one in which US equity markets rise by 30% and another in which they fall by -30%.
If we focus on the extreme scenarios, we can see that the option is behaving as expected. When markets rise 30%, the unhedged portfolio gains 12.1% ($121k) and the hedged portfolio only earns 10.8% ($108k). The hedged portfolio underperforms because it has 1% less of an equity allocation – that’s how we paid for the option. In a +30% market move, the 1% under allocation to equity would cost the portfolio about 0.30%. The put option would be near worthless and cost the hedged portfolio another 1% for a total of about 1.3% ($13k). Thus, in a bull market, the hedged portfolio underperforms the unhedged portfolio.
The unhedged portfolio would lose -12.1% (-$121k) in the opposite scenario, a -30% market decline. The hedged portfolio would only lose -3.3% (-$33k). This downside protection is exactly why an advisor would purchase an option in for their client, as, in this case, the hedged portfolio would be expected to outperform the unhedged portfolio by about $88k. So the option has clearly done its job, and the PCT graphic paints a very clear picture for both the advisor and client of the importance of hedging a portfolio. We can also look at the result for smaller moves of +/- 10% and +/-20% accordingly.
If you are wondering why the hedged portfolio outperforms in a -10% equity market when it would expire worthlessly, then recall that we chose a 14% OTM option and these scenarios are considered instantaneous shocks. There is no time component and we are not assuming that the option is at expiration. So the option would increase in price dramatically if the equity markets fell by 10% today, which is why that hedged portfolio outperforms the unhedged portfolio so dramatically in a -10% scenario.
Incidentally, the long-term US Treasury portfolio with an initial value of $400k would be expected to gain about $64k, while the $600k SPY would be expected to lose $184k. This is important because simply looking at a portfolio with SPY and an option is very straight forward and would not require our software at all. But when portfolios get more complex with many different assets, Portfolio Crash Tests’ scenarios can become an invaluable part of an advisor’s toolkit to illustrate the before and after effects of hedging and rebalancing decisions.
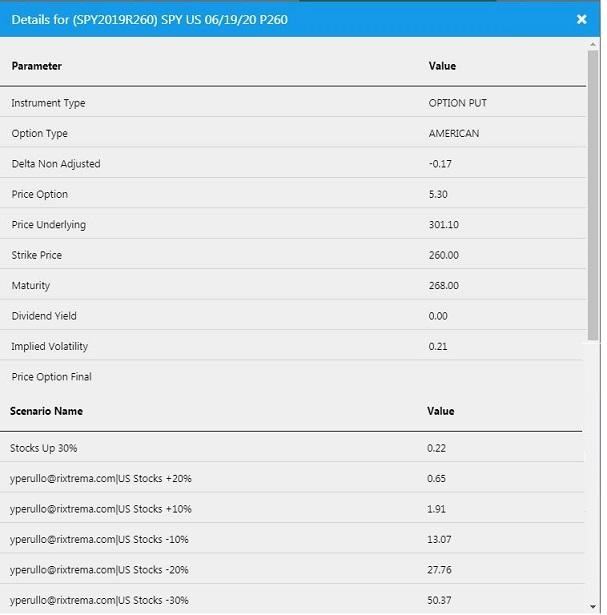
You can always see the assumptions and the pricing for the options in PCT Pro – that can be a worthwhile sanity check to see if you’ve modeled them correctly (Figure 3).
PCT Pro is one of the few financial planning software available to advisors that properly applies stresses to non-conventional assets. The same analysis can be applied to structured notes with more involved assumptions regarding caps, floors, etc.
Here we looked at 6 scenarios. In the next post, I will explain the Risk Grid – what it is and how it can be used to quickly and easily illustrate before and after scenario effects for portfolio decisions across 25 scenarios that stress two factors simultaneously. It’s one of my favorite ways to compare the portfolios when making hedging decisions or using some of the more esoteric asset types that many of our clients employ.
As with any of Larkspur-Rixtrema’s financial planning software, do not hesitate to request information or ask any questions to our Client Success Team at clientsuccess@rixtrema.com. At our blog, you can read many more PCT case studies, subscribe to our newsletter, and read our team’s market commentary and get investment ideas.


